$AEON ⚡ AEON Lighting Up the Warning Signals! Opportunity or Exhaustion?
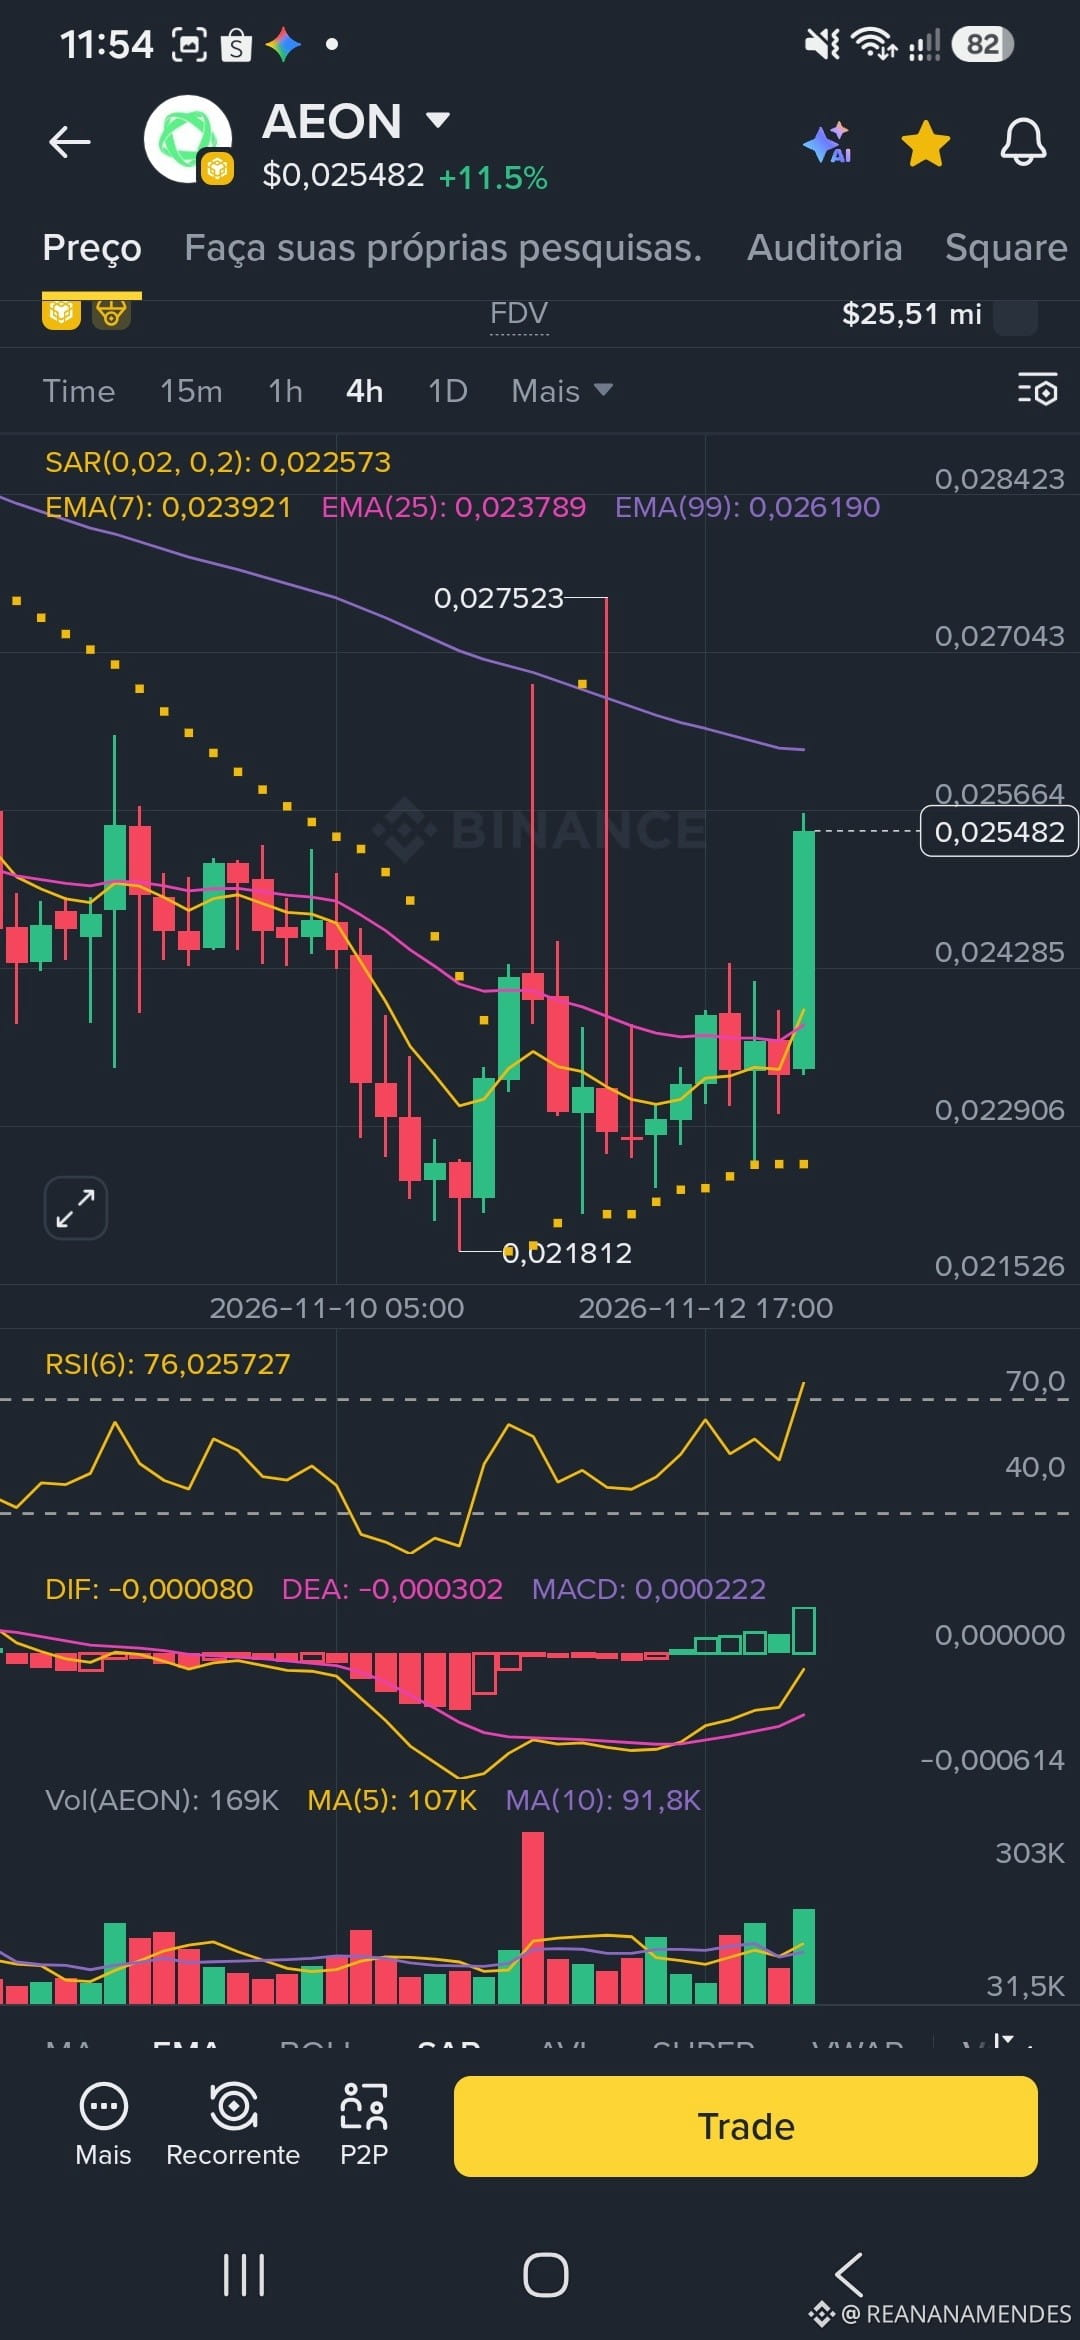
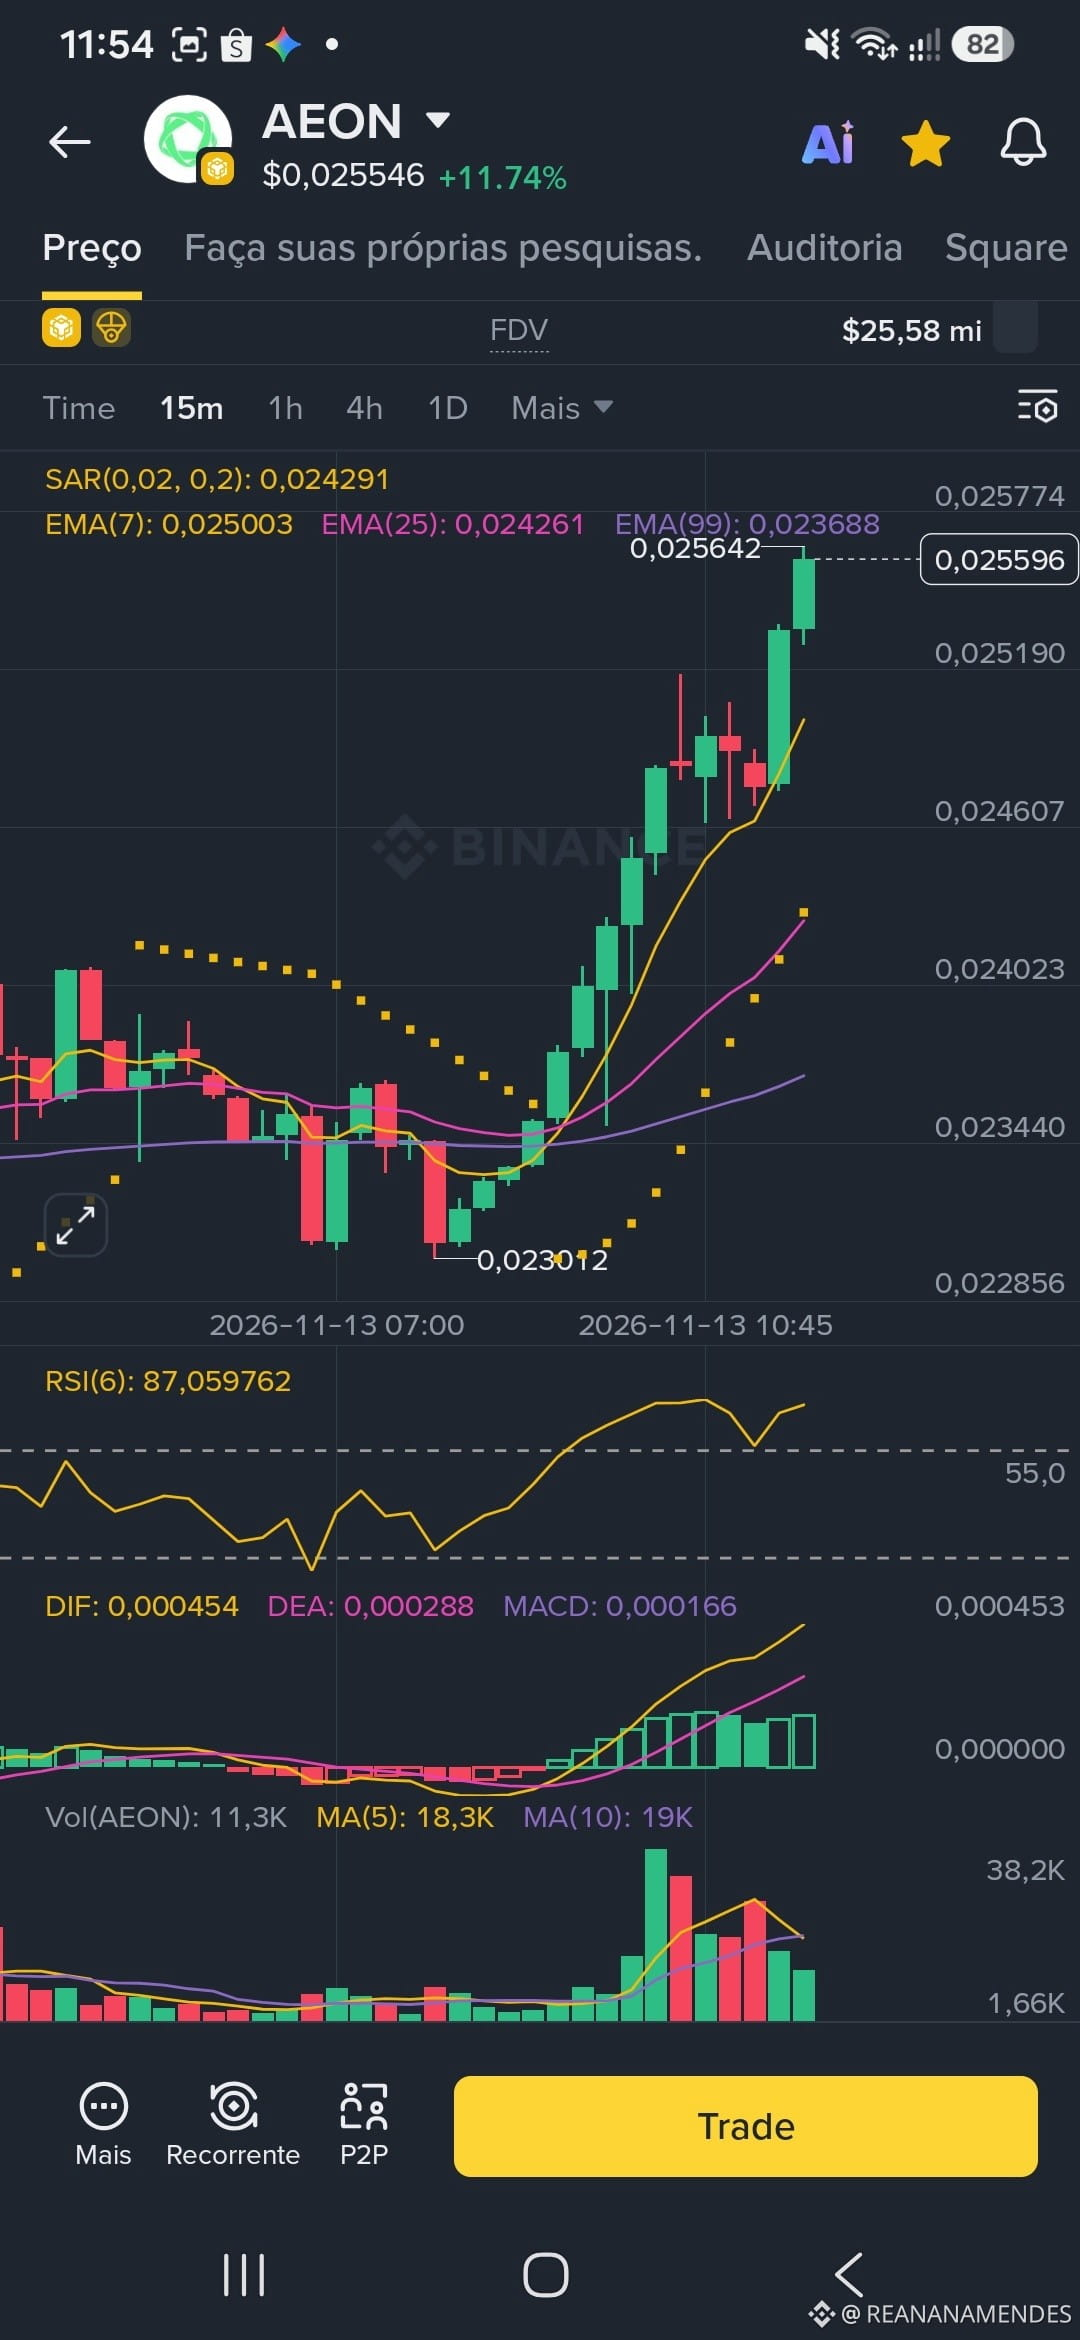
Keep an eye on the AEON chart right now! The asset surged to around $0.0255 with interesting volume and strong intraday momentum. Let's look at the indicators:
RSI on Alert: On the 15m chart, the RSI hit 87, showing that the asset is stretched in the short term. On the 4h chart, it's around 76, reflecting dominant buying strength but hovering near temporary exhaustion zones.
MACD Crossover: The indicator continues to point to solid buying pressure, supported by the dynamic Parabolic SAR.
Moving Averages: The EMA(7) is clearly sloping upward, leading this 15-minute rally.
⚠️ Trader's View: The outlook is highly bullish in the very short term, but overbought zones call for maximum discipline. No FOMO without risk management! Set your Take-Profit targets and keep your Stop-Loss in place.
Share your thoughts in the comments! Let's grow together on #Binance Square. 📈🔥
Keep an eye on the AEON chart right now! The asset surged to around $0.0255 with interesting volume and strong intraday momentum. Let's look at the indicators:
RSI on Alert: On the 15m chart, the RSI hit 87, showing that the asset is stretched in the short term. On the 4h chart, it's around 76, reflecting dominant buying strength but hovering near temporary exhaustion zones.
MACD Crossover: The indicator continues to point to solid buying pressure, supported by the dynamic Parabolic SAR.
Moving Averages: The EMA(7) is clearly sloping upward, leading this 15-minute rally.
⚠️ Trader's View: The outlook is highly bullish in the very short term, but overbought zones call for maximum discipline. No FOMO without risk management! Set your Take-Profit targets and keep your Stop-Loss in place.
Share your thoughts in the comments! Let's grow together on #Binance Square. 📈🔥