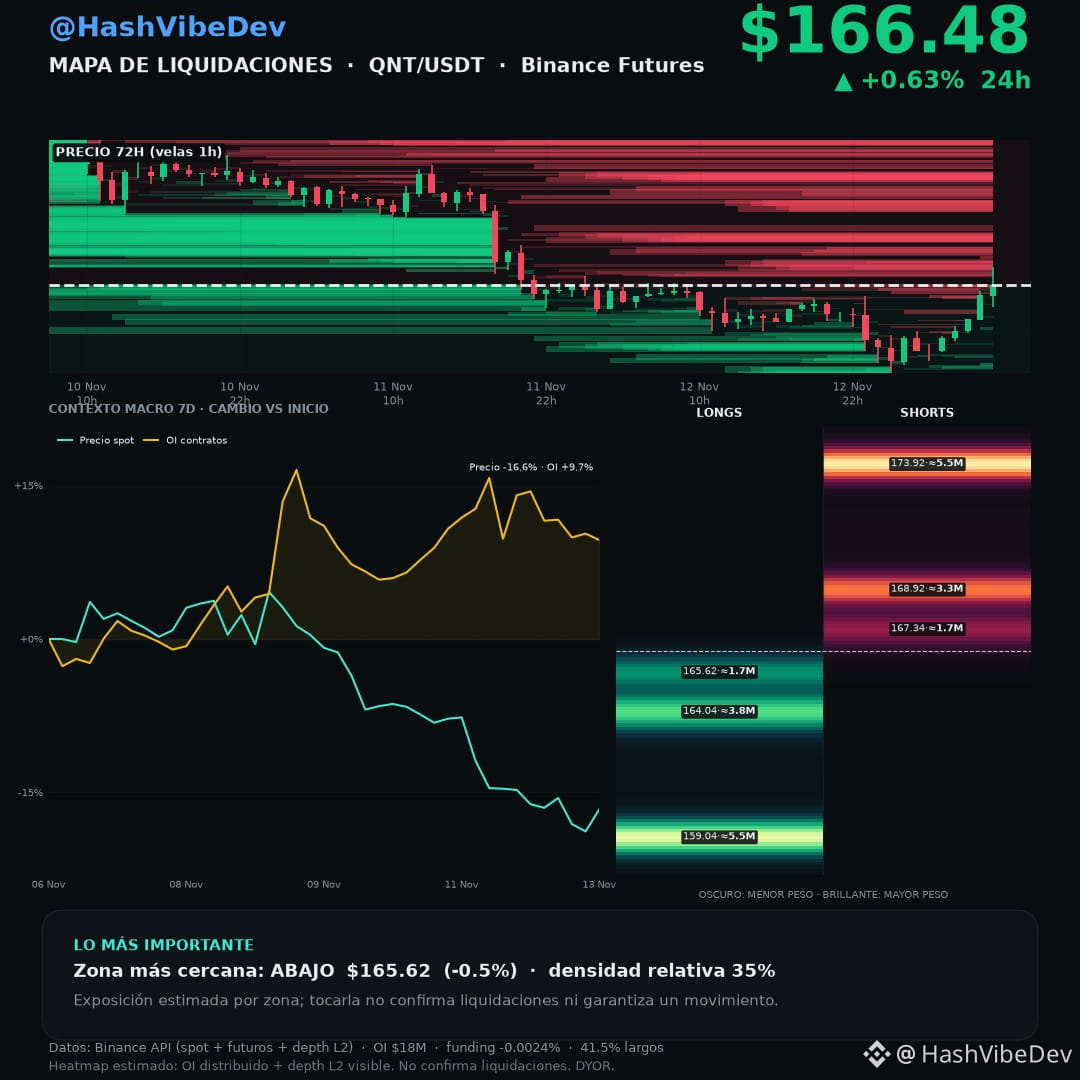
Since yesterday’s post, QNT recovered to $162.35 (Nov 12, 17:30 UTC), then fell below $159.11 (Nov 13, 03:45) and hit $154.56 (05:55). At 13:59 UTC, it was trading at $166.48 (+0.63% in 24 h), within the $154.56–$168.97 range.
Over 24 h, contract OI fell 2.1%; over 7 days, the price fell 16.6% while OI rose 9.7%. The taker buy/sell ratio was 0.98 over 24 h and 1.36 in the latest hourly snapshot: recent buying is emerging, but it doesn’t confirm a reversal.
The map estimates the nearest zones at $165.62 below and $167.34 above (≈$1.7M each). These are estimated exposure zones; touching them does not confirm liquidations or direction.
Will it hold $165.62 or break above $167.34? Follow the series.
#QNT $QNT
Not financial advice. DYOR.
Over 24 h, contract OI fell 2.1%; over 7 days, the price fell 16.6% while OI rose 9.7%. The taker buy/sell ratio was 0.98 over 24 h and 1.36 in the latest hourly snapshot: recent buying is emerging, but it doesn’t confirm a reversal.
The map estimates the nearest zones at $165.62 below and $167.34 above (≈$1.7M each). These are estimated exposure zones; touching them does not confirm liquidations or direction.
Will it hold $165.62 or break above $167.34? Follow the series.
#QNT $QNT
Not financial advice. DYOR.