$AR : Rethinking Volume as a One‑Way Signal
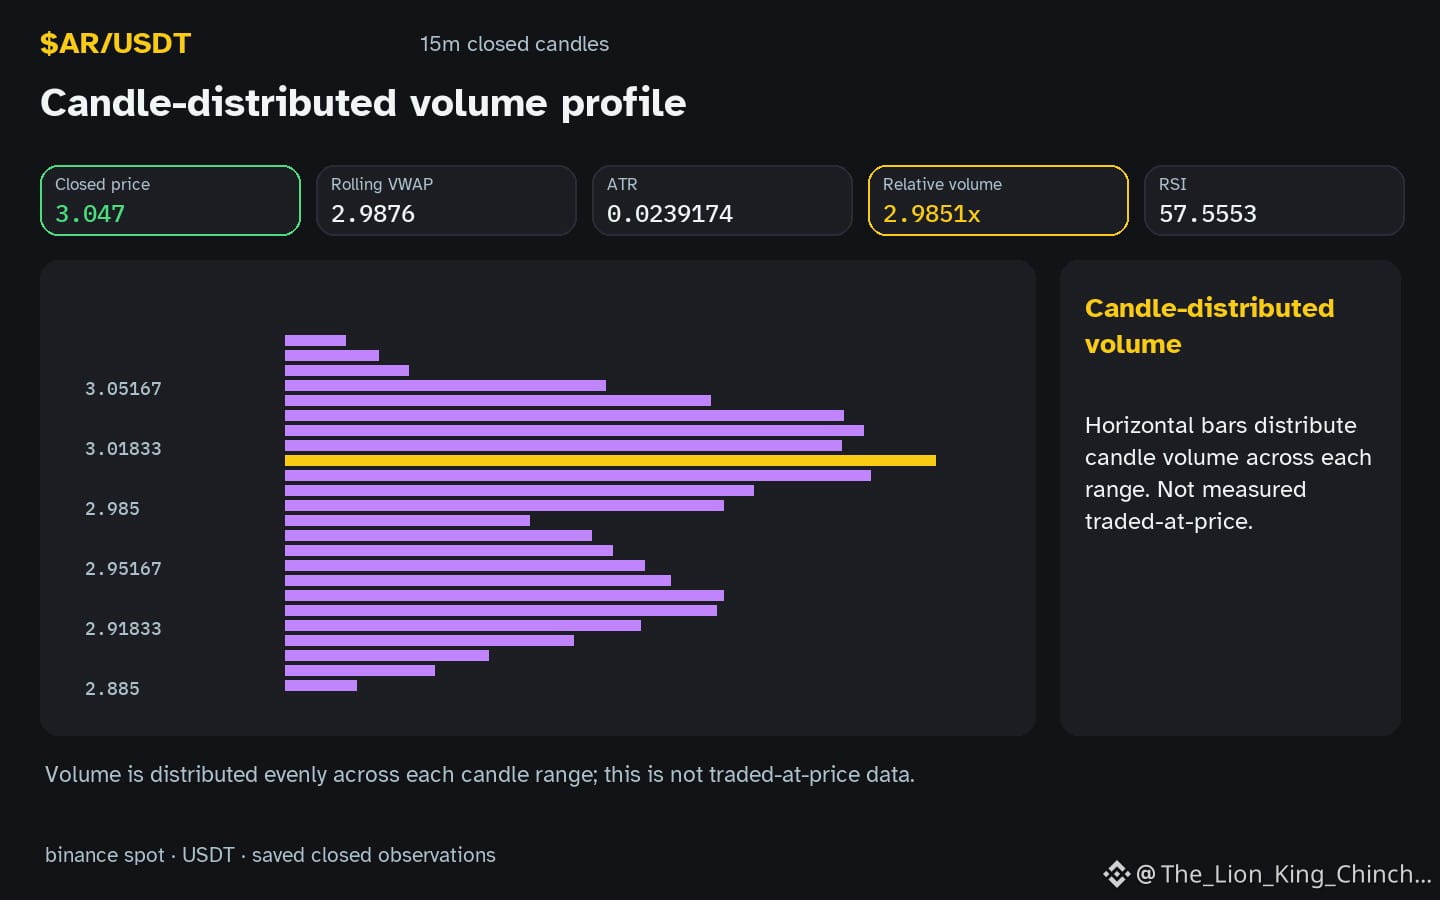
When I glance at $AR and see the candle pointing down while the volume gauge reads 2.99x baseline, a tiny voice in my research notebook wonders if the old rule – "more volume always means bullish accumulation" – still applies. The tempting shortcut is to label any above‑baseline volume as buying pressure, but that ignores the directional context.
A more careful interpretation asks: could the heightened volume simply reflect heightened trading activity on a down move, perhaps driven by stop‑losses or short covering? In this scenario the volume is a neutral amplifier, not a directional cue. The observation that the hourly direction is down while volume is above baseline supports this alternative reading.
A useful next observation would be to watch the next closed candle. If the price rebounds and RSI 57.6 rises toward neutral, the earlier volume spike may have been a precursor to accumulation. Conversely, if the down trend continues and RSI stays low, the volume likely represented distribution. By pairing direction with volume and a single momentum metric, we avoid the one‑way myth and keep our analysis grounded in what the charts actually show. 😊
Probabilistic market research, not a recommendation or guaranteed return.
The comparison to keep in mind: $BTC has hourly direction down and volume not above its baseline; $SOPH has hourly direction up and volume above its baseline. This alone does not establish correlation.
#AR #BTC #SOPH #LearnCrypto
When I glance at $AR and see the candle pointing down while the volume gauge reads 2.99x baseline, a tiny voice in my research notebook wonders if the old rule – "more volume always means bullish accumulation" – still applies. The tempting shortcut is to label any above‑baseline volume as buying pressure, but that ignores the directional context.
A more careful interpretation asks: could the heightened volume simply reflect heightened trading activity on a down move, perhaps driven by stop‑losses or short covering? In this scenario the volume is a neutral amplifier, not a directional cue. The observation that the hourly direction is down while volume is above baseline supports this alternative reading.
A useful next observation would be to watch the next closed candle. If the price rebounds and RSI 57.6 rises toward neutral, the earlier volume spike may have been a precursor to accumulation. Conversely, if the down trend continues and RSI stays low, the volume likely represented distribution. By pairing direction with volume and a single momentum metric, we avoid the one‑way myth and keep our analysis grounded in what the charts actually show. 😊
Probabilistic market research, not a recommendation or guaranteed return.
The comparison to keep in mind: $BTC has hourly direction down and volume not above its baseline; $SOPH has hourly direction up and volume above its baseline. This alone does not establish correlation.
#AR #BTC #SOPH #LearnCrypto