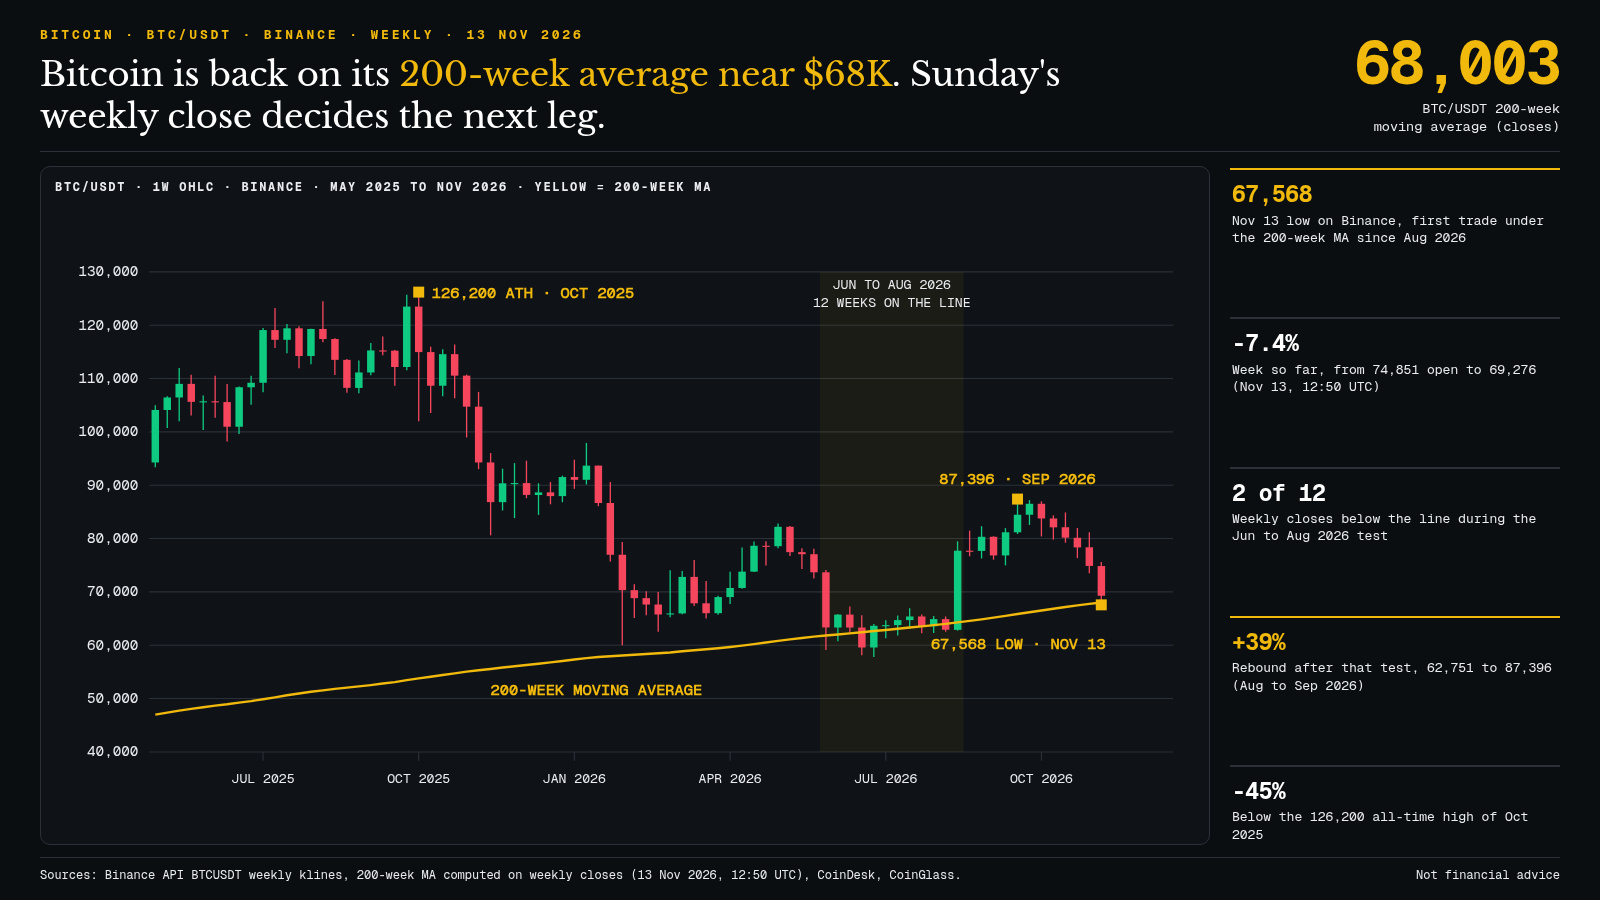
The $BTC has returned to its 200-week moving average, around $68,000. It’s the line many consider the floor of bear-market cycles, and it has just been touched for the first time since August.
On the Binance weekly chart, the yellow curve is this average, calculated over 200 weekly closes: $68,003 today. This morning’s low of $67,568 briefly dipped below it. At 12:50 UTC, BTC was back at $69,276, down 7.4% since Monday’s open ($74,851).
What makes this level interesting is what happened last summer. From early June to mid-August 2026, the price spent 12 weeks hugging this line, with wicks as low as $57,800, but only 2 weekly closes below it. Then it climbed from $62,751 to $87,396 by late September, up 39%.
The backdrop is less favorable this time, however. The dollar (DXY) is above 103, its highest level since April 2025, and the market is pricing in a Fed rate hike in December (CoinDesk, 13/11). CoinGlass counts $1.64 billion in liquidations over 24 hours, 88.7% of them on the buy side. BTC remains 45% below its October 2025 record of $126,200.
My take: Sunday evening’s weekly close (00:00 UTC) matters more than the week’s wicks. A close above $68,000 would recreate last summer’s scenario, with $72,000 and then $75,000 as the first resistance levels. A decisive close below would open up the $62,000–$64,000 zone, the summer lows. In between, expect violent swings around the line.
Do you see this 200-week average holding on Sunday, or is this time different?
#Bitcoin #BTC
Sources: Binance BTCUSDT weekly candlestick API, 200-week moving average calculated using weekly closes (13/11, 12:50 UTC), CoinDesk and CoinGlass (13/11). Not financial advice.
On the Binance weekly chart, the yellow curve is this average, calculated over 200 weekly closes: $68,003 today. This morning’s low of $67,568 briefly dipped below it. At 12:50 UTC, BTC was back at $69,276, down 7.4% since Monday’s open ($74,851).
What makes this level interesting is what happened last summer. From early June to mid-August 2026, the price spent 12 weeks hugging this line, with wicks as low as $57,800, but only 2 weekly closes below it. Then it climbed from $62,751 to $87,396 by late September, up 39%.
The backdrop is less favorable this time, however. The dollar (DXY) is above 103, its highest level since April 2025, and the market is pricing in a Fed rate hike in December (CoinDesk, 13/11). CoinGlass counts $1.64 billion in liquidations over 24 hours, 88.7% of them on the buy side. BTC remains 45% below its October 2025 record of $126,200.
My take: Sunday evening’s weekly close (00:00 UTC) matters more than the week’s wicks. A close above $68,000 would recreate last summer’s scenario, with $72,000 and then $75,000 as the first resistance levels. A decisive close below would open up the $62,000–$64,000 zone, the summer lows. In between, expect violent swings around the line.
Do you see this 200-week average holding on Sunday, or is this time different?
#Bitcoin #BTC
Sources: Binance BTCUSDT weekly candlestick API, 200-week moving average calculated using weekly closes (13/11, 12:50 UTC), CoinDesk and CoinGlass (13/11). Not financial advice.