🚀 Flash Analysis $SOL /USDT: Rebound underway or bull trap? 📊🔥
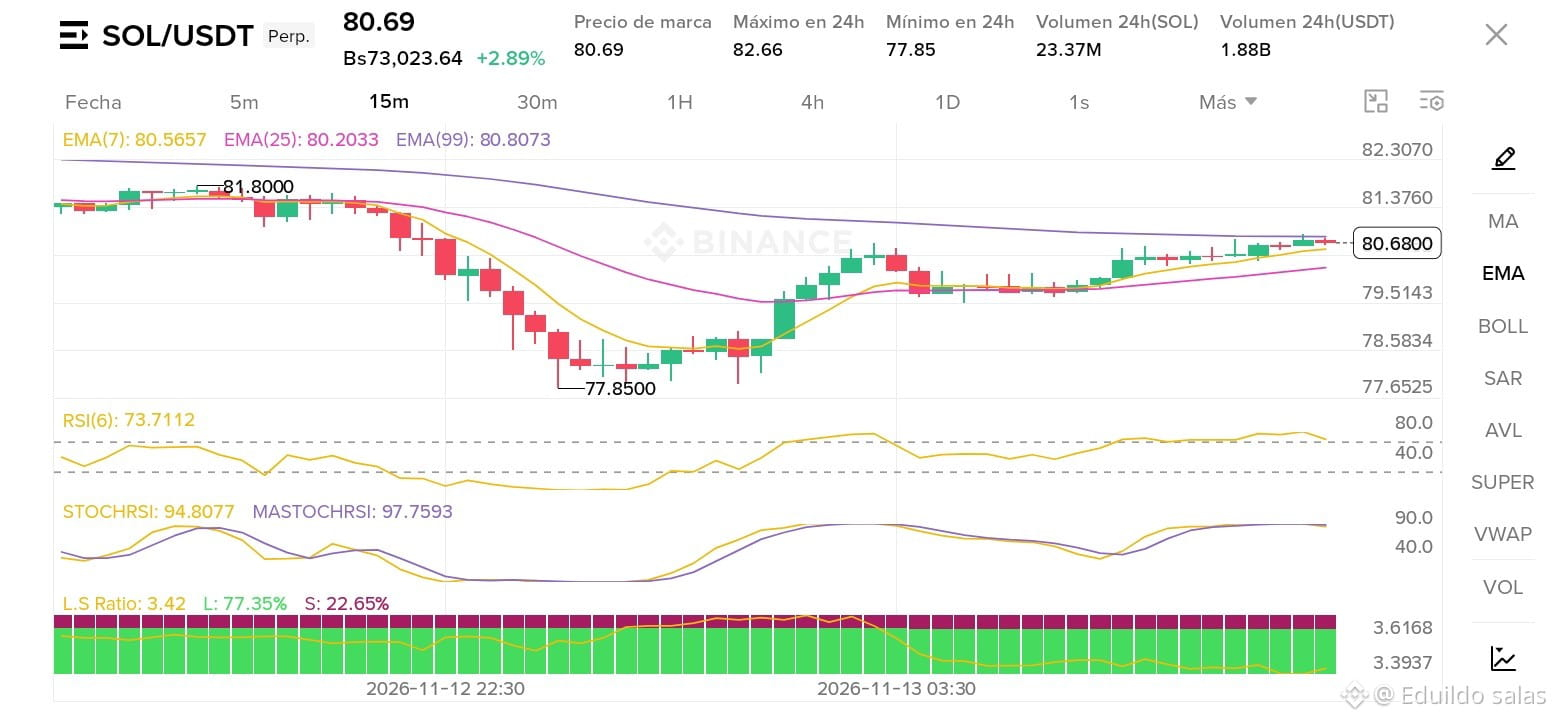
Price action on the Solana (SOL/USDT) 15-minute chart shows a key move after touching a recent low at $77.85 USDT. The price is currently trading at $80.69 USDT (+2.89%), attempting to consolidate a short-term recovery.
🔎 Key chart details:
Moving Average Structure (EMA): The fast EMAs are converging near the current price zone. EMA(7) is at $80.56, EMA(25) at $80.20, and EMA(99) at $80.80, revealing a direct friction zone where the price is looking to break through the long-term average's immediate resistance.
RSI(6) at 73.71: The Relative Strength Index shows strong short-term buying momentum following the rebound from the lows, entering a watch zone due to possible temporary overbought conditions.
StochRSI: It is elevated at 94.80 (with the fast indicator at 97.75), indicating that the immediate upward move is strong, but calling for caution in case of a possible pause or sideways consolidation before continuing.
Long/Short Ratio: The market shows an L/S Ratio of 3.42 (with 77.35% long positions versus 22.65% short positions), reflecting the predominantly optimistic outlook of the retail community betting on a recovery.
⚡ Outlook: The key support to watch remains firm at $77.85, while a sustained break above $81.80 would open the way to higher targets.
Are you buying this momentum, or waiting for confirmation? Let me know in the comments! 👇💬
#Solana #BinanceSquare #HuangExitNvidiaStrategyInFocus #binancepick
Price action on the Solana (SOL/USDT) 15-minute chart shows a key move after touching a recent low at $77.85 USDT. The price is currently trading at $80.69 USDT (+2.89%), attempting to consolidate a short-term recovery.
🔎 Key chart details:
Moving Average Structure (EMA): The fast EMAs are converging near the current price zone. EMA(7) is at $80.56, EMA(25) at $80.20, and EMA(99) at $80.80, revealing a direct friction zone where the price is looking to break through the long-term average's immediate resistance.
RSI(6) at 73.71: The Relative Strength Index shows strong short-term buying momentum following the rebound from the lows, entering a watch zone due to possible temporary overbought conditions.
StochRSI: It is elevated at 94.80 (with the fast indicator at 97.75), indicating that the immediate upward move is strong, but calling for caution in case of a possible pause or sideways consolidation before continuing.
Long/Short Ratio: The market shows an L/S Ratio of 3.42 (with 77.35% long positions versus 22.65% short positions), reflecting the predominantly optimistic outlook of the retail community betting on a recovery.
⚡ Outlook: The key support to watch remains firm at $77.85, while a sustained break above $81.80 would open the way to higher targets.
Are you buying this momentum, or waiting for confirmation? Let me know in the comments! 👇💬
#Solana #BinanceSquare #HuangExitNvidiaStrategyInFocus #binancepick