$SNXXB : Stalled Breakout Candles: A Forensic View
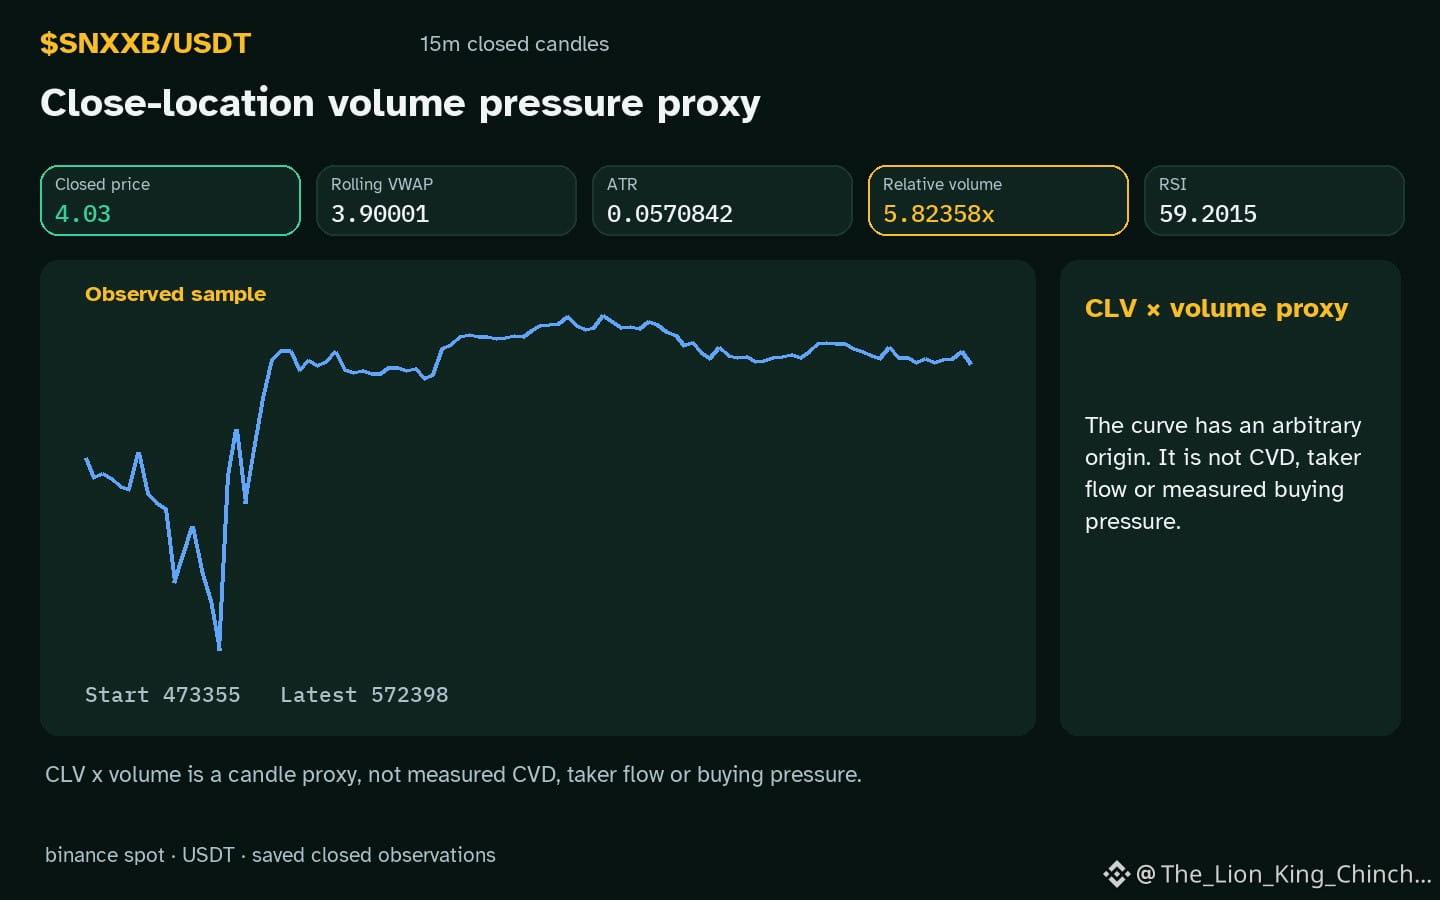
Why does $SNXXB show an up hourly direction while the candle stalls near a recorded resistance level? The observation notes a candle that pushed above resistance but failed to close higher, accompanied by volume that sits 5.82x baseline. One possible clue is that the high baseline ratio could indicate genuine buying pressure that was unable to sustain momentum, perhaps because the price encountered a hidden supply wall. An alternative reading is that the volume spike reflects a short‑term burst of activity unrelated to the breakout, such as a news‑driven spike that evaporated before the close, leaving the candle to retreat.
Both scenarios rely on the same limited data, so each can be weakened by further closed‑candle evidence. If the next hourly candle closes firmly above resistance with sustained volume at or above the baseline ratio, the supply‑wall hypothesis loses weight and the burst‑activity view gains plausibility. Conversely, if the subsequent candle closes back inside the prior range and volume drops below baseline, the idea of a fleeting spike becomes less credible, supporting the notion of a structural barrier at resistance. Until that future evidence arrives, the stalled candle remains an ambiguous signal that warrants cautious monitoring without assuming any trader intent or market direction.
Probabilistic market research, not a recommendation or guaranteed return.
#SNXXB
Why does $SNXXB show an up hourly direction while the candle stalls near a recorded resistance level? The observation notes a candle that pushed above resistance but failed to close higher, accompanied by volume that sits 5.82x baseline. One possible clue is that the high baseline ratio could indicate genuine buying pressure that was unable to sustain momentum, perhaps because the price encountered a hidden supply wall. An alternative reading is that the volume spike reflects a short‑term burst of activity unrelated to the breakout, such as a news‑driven spike that evaporated before the close, leaving the candle to retreat.
Both scenarios rely on the same limited data, so each can be weakened by further closed‑candle evidence. If the next hourly candle closes firmly above resistance with sustained volume at or above the baseline ratio, the supply‑wall hypothesis loses weight and the burst‑activity view gains plausibility. Conversely, if the subsequent candle closes back inside the prior range and volume drops below baseline, the idea of a fleeting spike becomes less credible, supporting the notion of a structural barrier at resistance. Until that future evidence arrives, the stalled candle remains an ambiguous signal that warrants cautious monitoring without assuming any trader intent or market direction.
Probabilistic market research, not a recommendation or guaranteed return.
#SNXXB