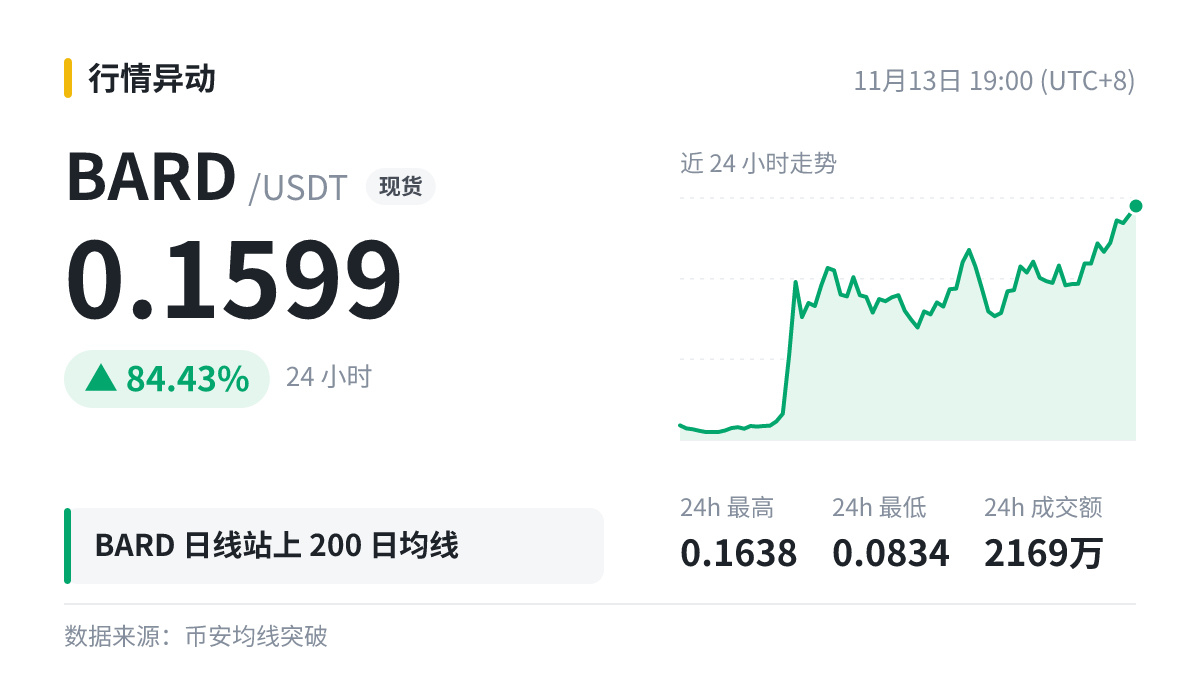
$BARD On the daily chart, price has moved above MA200 (0.1476).
Let’s break down the moving averages based on this data.
The direction of the moving average itself is also worth watching: a price moving above it while it’s still trending downward is not the same as moving above it when it has already flattened out.
Moving above a long-term moving average is often interpreted as a sign that the trend is strengthening, while falling below it is often seen as a sign of weakness. But a single crossover is far from enough to tell us much.
Extreme readings often come with larger swings. At times like these, it’s better to reduce your position size rather than make a big bet.
Just chatting—whether you make or lose money, you have to bear the consequences yourself.
Let’s break down the moving averages based on this data.
The direction of the moving average itself is also worth watching: a price moving above it while it’s still trending downward is not the same as moving above it when it has already flattened out.
Moving above a long-term moving average is often interpreted as a sign that the trend is strengthening, while falling below it is often seen as a sign of weakness. But a single crossover is far from enough to tell us much.
Extreme readings often come with larger swings. At times like these, it’s better to reduce your position size rather than make a big bet.
Just chatting—whether you make or lose money, you have to bear the consequences yourself.