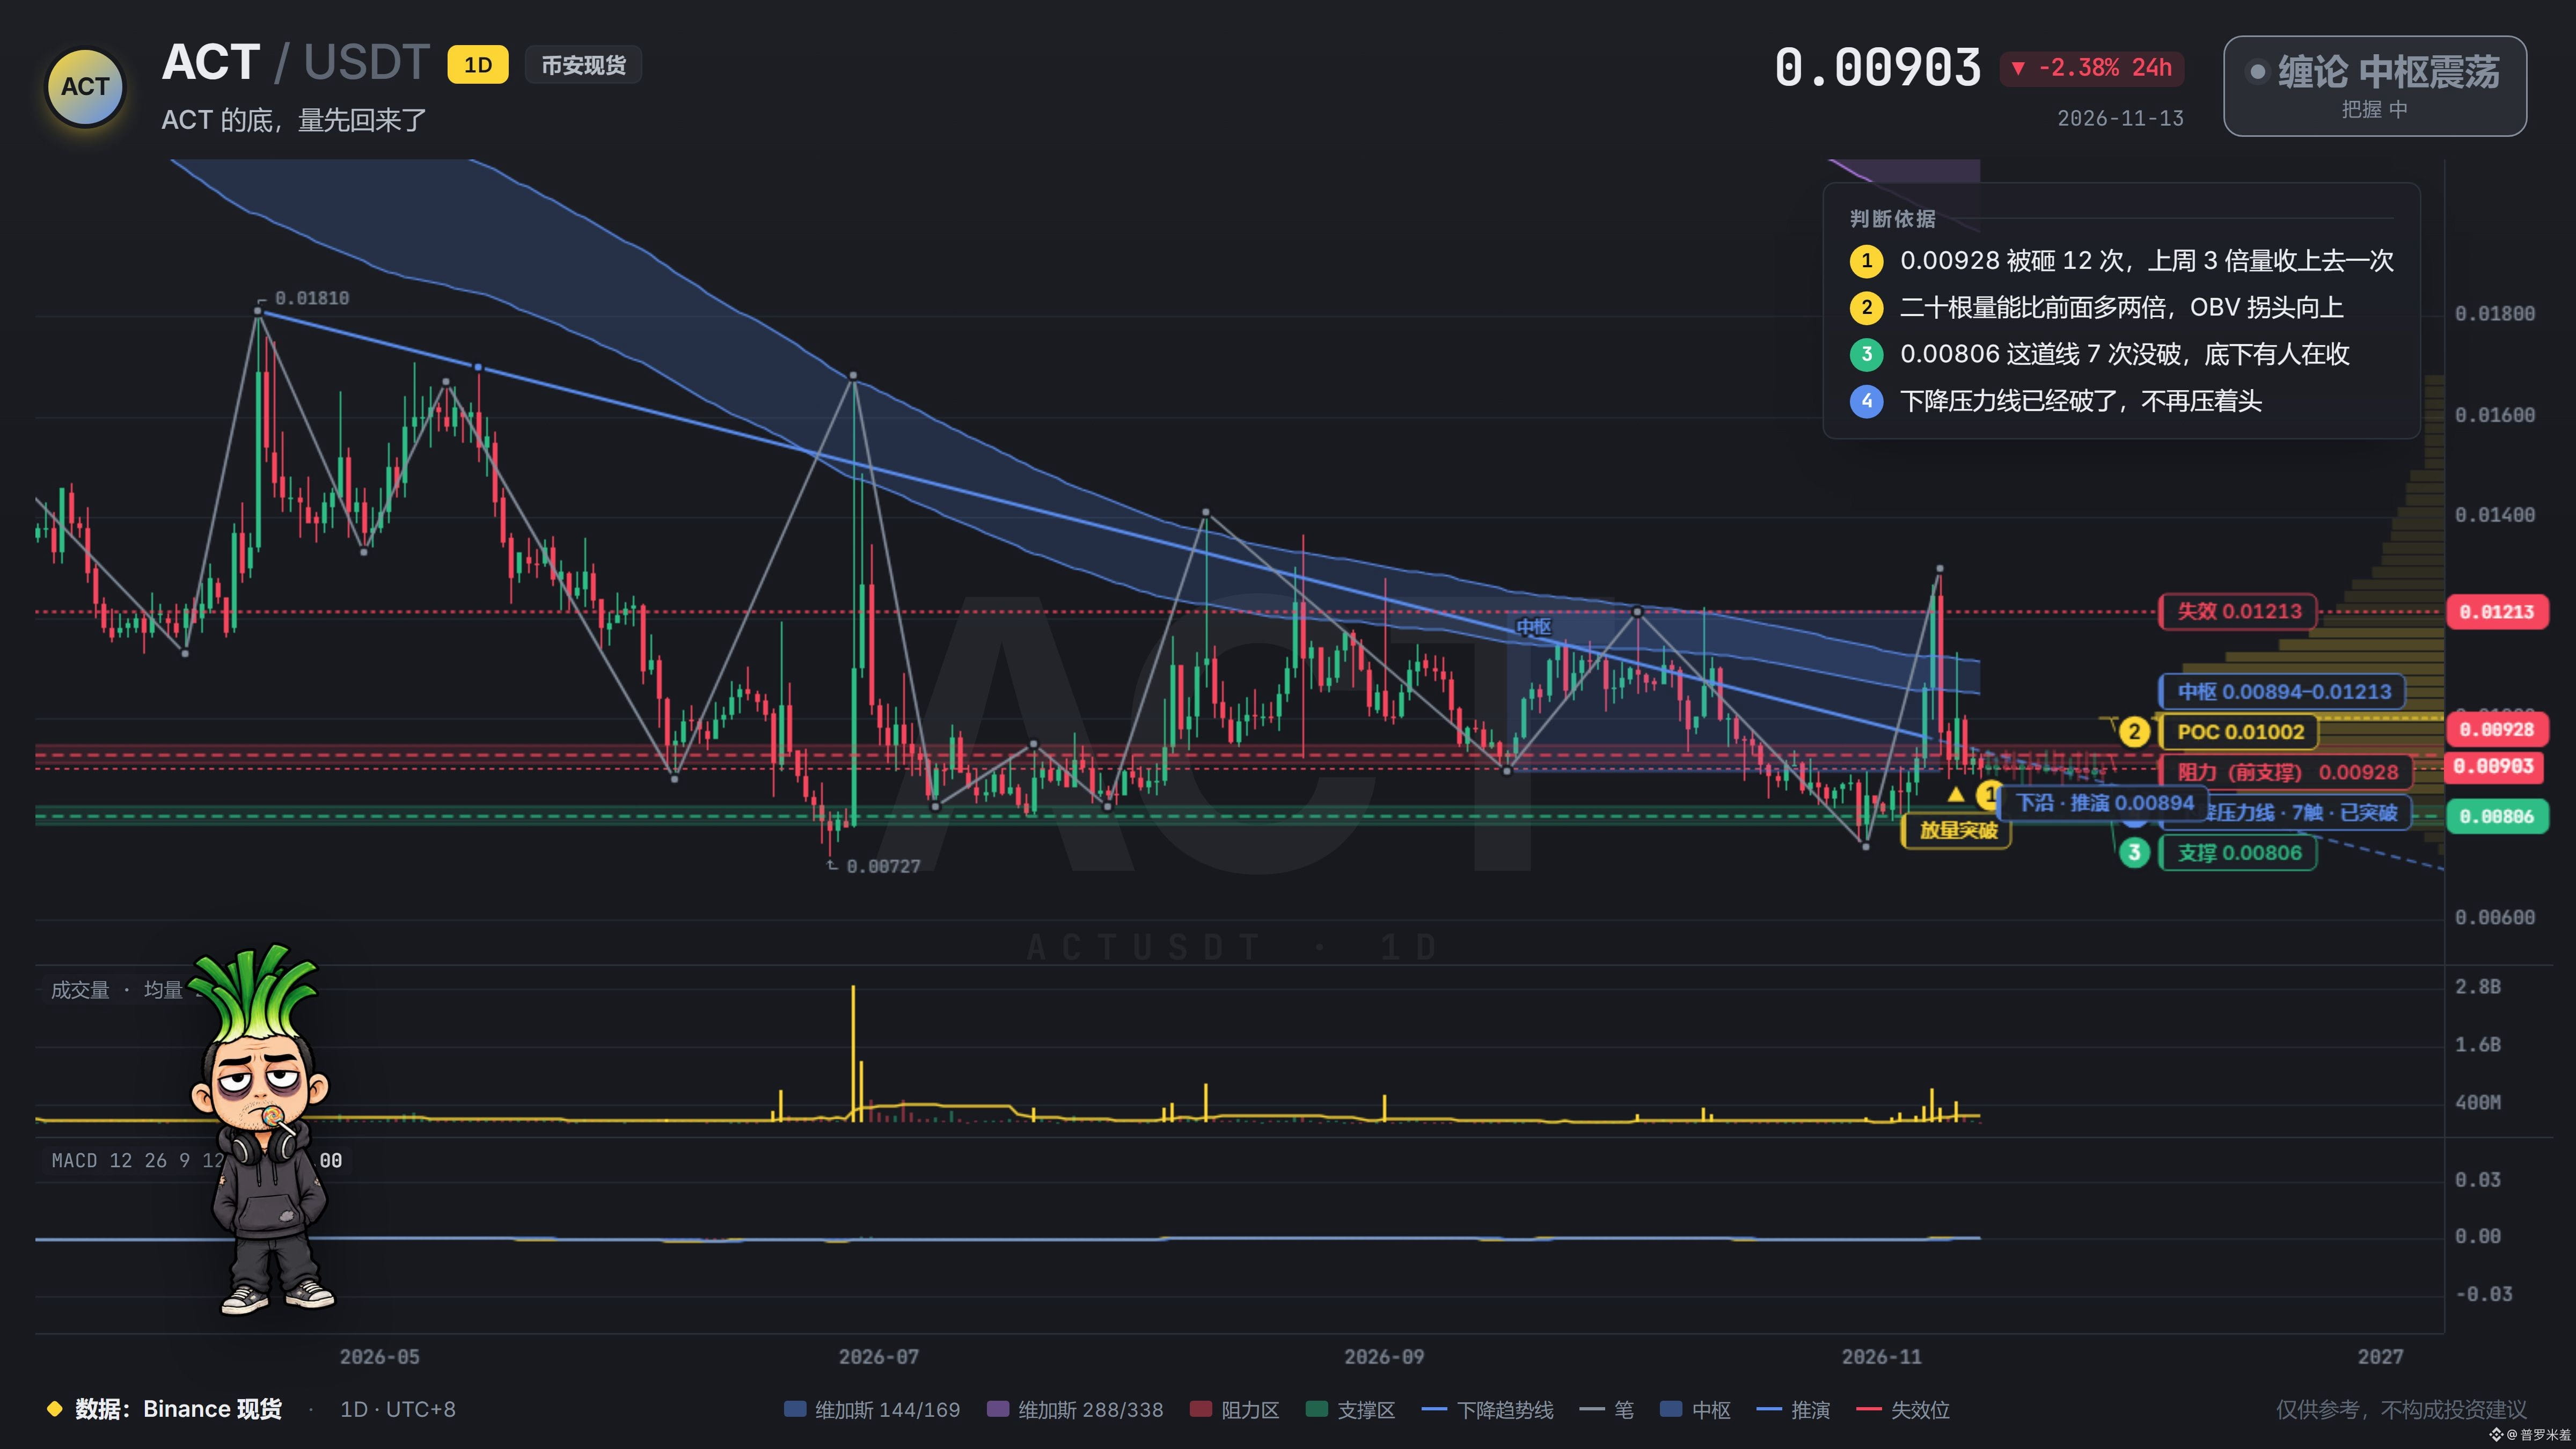
$ACT has fallen more than 80% from its highs, and no one in the group has mentioned it for ages. You can’t even be bothered to open it and look. The worst part of being stuck deep in the red isn’t losing money—it’s that you’ve lost even the energy to complain.
The daily chart does show a few signs of life: the 0.00928 level has been hammered 12 times this year, and last Monday a candle with three times the usual volume closed above it. Volume over the last twenty-odd candles is twice what it was before, and OBV has turned up too. A slow bleed happens on low volume; this stretch doesn’t look like that.
I can’t say whether the bottom is right at that 0.00806 line. But volume has come back first, and this money isn’t here to watch it slowly bleed lower.
If you’re still holding, don’t start tallying things up at the floor.
The daily chart does show a few signs of life: the 0.00928 level has been hammered 12 times this year, and last Monday a candle with three times the usual volume closed above it. Volume over the last twenty-odd candles is twice what it was before, and OBV has turned up too. A slow bleed happens on low volume; this stretch doesn’t look like that.
I can’t say whether the bottom is right at that 0.00806 line. But volume has come back first, and this money isn’t here to watch it slowly bleed lower.
If you’re still holding, don’t start tallying things up at the floor.