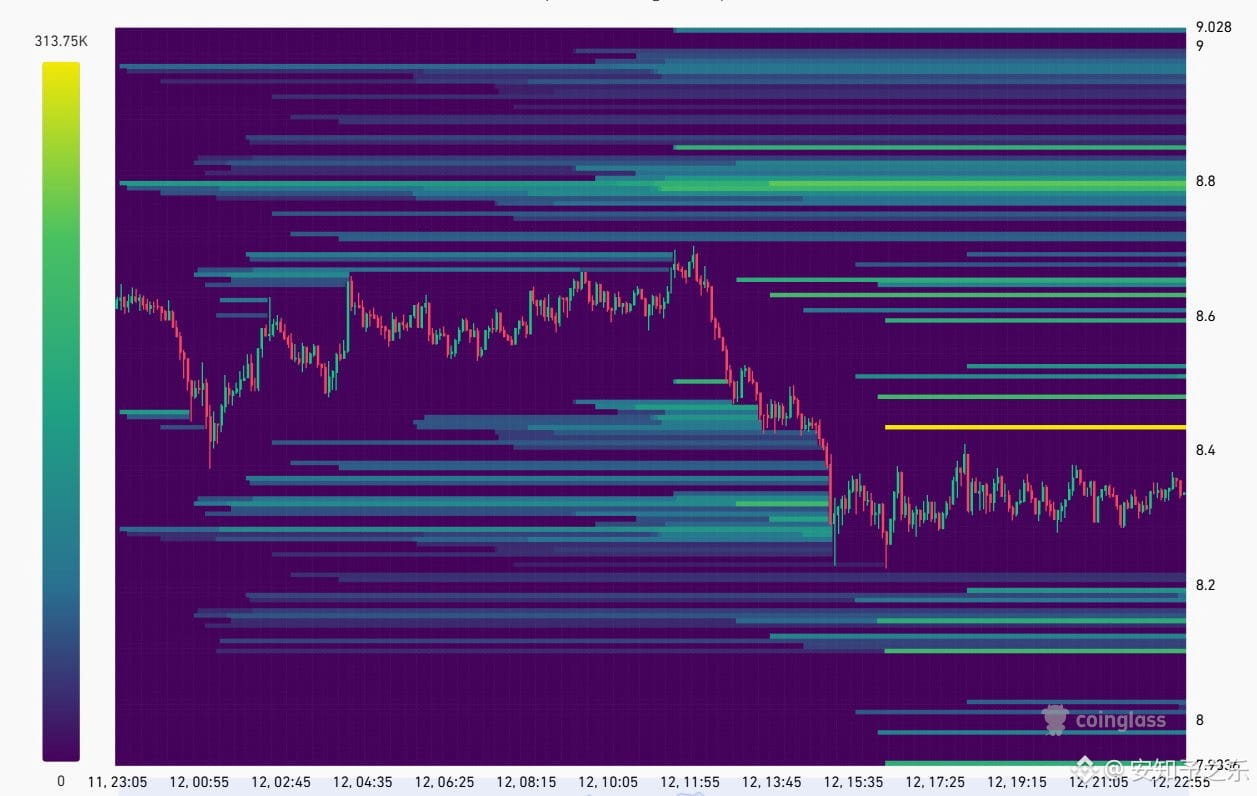
$AVAX The densest cluster of short positions is just 1% above the current price, already highlighted in yellow on the heatmap.
This afternoon’s drop wiped out long liquidity at 8.30–8.35, with the price bottoming at 8.22.
After that, AVAX traded sideways in the narrow 8.28–8.40 range for several hours.
During this consolidation, short positions kept piling up overhead.
The most prominent liquidity cluster on the entire chart is at 8.43.
Above that, the dense liquidity zones at 8.53, 8.65, and 8.80 hold even more fuel for a move.
Support below is much thinner, with only a small pool of long positions at 8.10–8.19.
Narrow-range trading beneath a large liquidity cluster often ends with a squeeze.
My prediction: First, price takes out 8.43, then pushes toward 8.65–8.80.
On the other hand, if AVAX breaks below 8.22 on high volume, the next target is the long-position pool at 8.10.
Which way will the range eventually break?
🟢 Up to 8.80
🔴 Down to 8.10
Share your take in the comments.
This afternoon’s drop wiped out long liquidity at 8.30–8.35, with the price bottoming at 8.22.
After that, AVAX traded sideways in the narrow 8.28–8.40 range for several hours.
During this consolidation, short positions kept piling up overhead.
The most prominent liquidity cluster on the entire chart is at 8.43.
Above that, the dense liquidity zones at 8.53, 8.65, and 8.80 hold even more fuel for a move.
Support below is much thinner, with only a small pool of long positions at 8.10–8.19.
Narrow-range trading beneath a large liquidity cluster often ends with a squeeze.
My prediction: First, price takes out 8.43, then pushes toward 8.65–8.80.
On the other hand, if AVAX breaks below 8.22 on high volume, the next target is the long-position pool at 8.10.
Which way will the range eventually break?
🟢 Up to 8.80
🔴 Down to 8.10
Share your take in the comments.