$INTCB : Why Volume Climax at the Bottom Often Looks Identical to Panic Collapse
$INTCB : Why does a surge of volume at the lower end of the range sometimes feel like capitulation and other times like a continuation signal? $INTCB is currently moving down inside the recorded range while volume sits above baseline.
**Myth:** High volume automatically means traders are giving up and a bottom is confirmed. **Reality:** Volume alone cannot reveal intent. A large spike may simply reflect a rapid price move that forces many market participants to adjust orders, creating a temporary imbalance. If the price decline is modest, the same volume could be part of normal market churn rather than a panic dump.
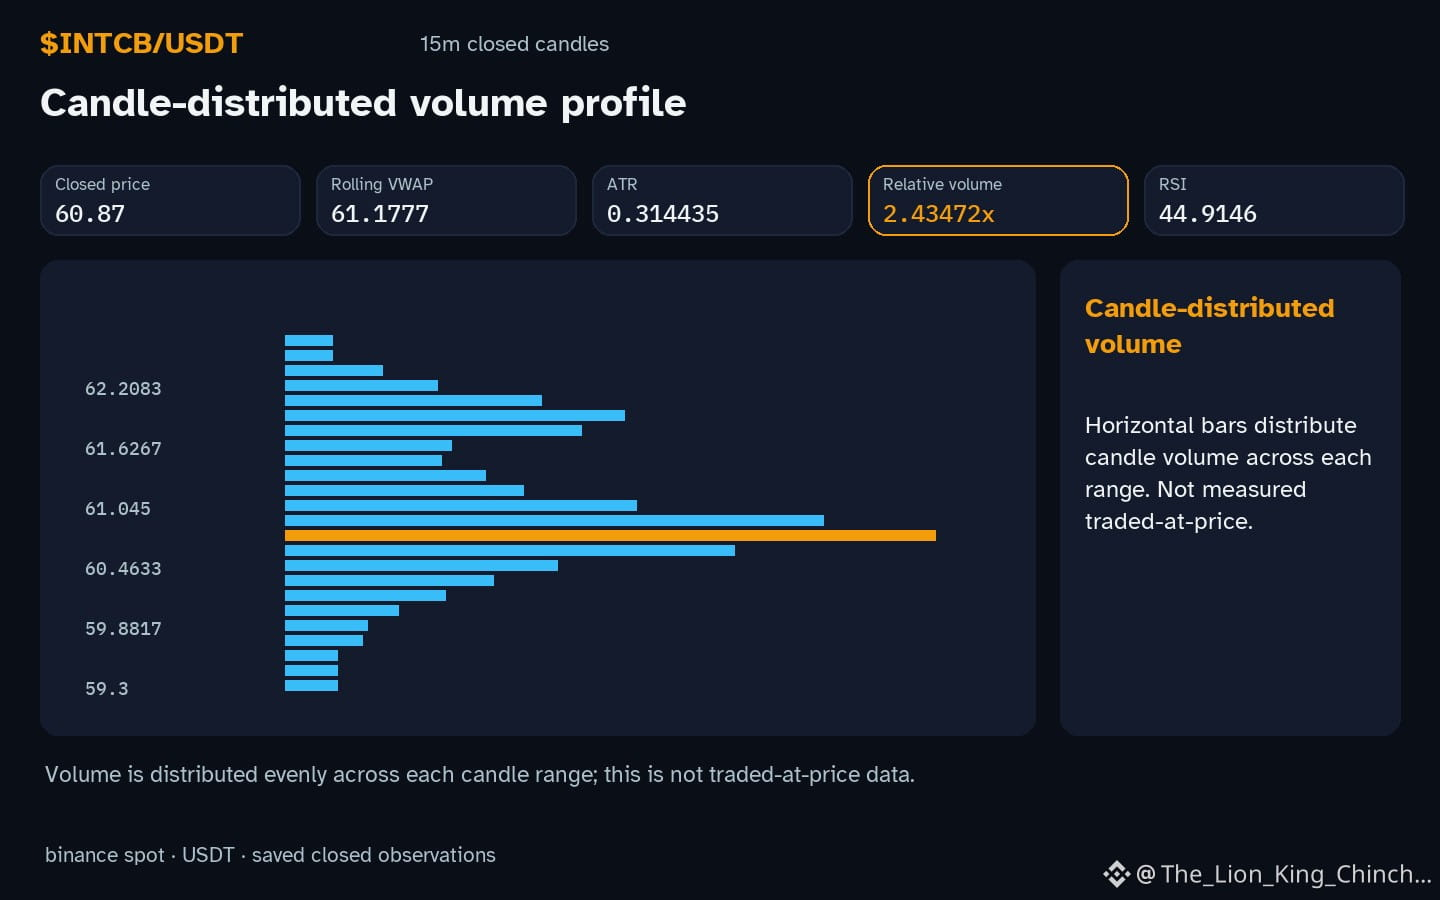
**Evidence:** The observation shows hourly direction down, price contained within local support and resistance, and relative volume 2.43x baseline. This pattern matches both a capitulation scenario. where exhausted sellers flood the market. and a continuation scenario. where aggressive buying absorbs the sell pressure and the down move pauses.
**Self‑check:** Track the next closed hourly candle. If the price rebounds sharply and RSI 44.9 rises above neutral, the volume likely represented a continuation cushion. If the price continues lower, breaks support, and volume remains elevated, the spike aligns with capitulation. Either outcome should be treated as a hypothesis, not a guarantee, and further candles are needed to validate the interpretation.
Probabilistic market research, not a recommendation or guaranteed return.
#INTCB #CryptoLearning
$INTCB : Why does a surge of volume at the lower end of the range sometimes feel like capitulation and other times like a continuation signal? $INTCB is currently moving down inside the recorded range while volume sits above baseline.
**Myth:** High volume automatically means traders are giving up and a bottom is confirmed. **Reality:** Volume alone cannot reveal intent. A large spike may simply reflect a rapid price move that forces many market participants to adjust orders, creating a temporary imbalance. If the price decline is modest, the same volume could be part of normal market churn rather than a panic dump.
**Evidence:** The observation shows hourly direction down, price contained within local support and resistance, and relative volume 2.43x baseline. This pattern matches both a capitulation scenario. where exhausted sellers flood the market. and a continuation scenario. where aggressive buying absorbs the sell pressure and the down move pauses.
**Self‑check:** Track the next closed hourly candle. If the price rebounds sharply and RSI 44.9 rises above neutral, the volume likely represented a continuation cushion. If the price continues lower, breaks support, and volume remains elevated, the spike aligns with capitulation. Either outcome should be treated as a hypothesis, not a guarantee, and further candles are needed to validate the interpretation.
Probabilistic market research, not a recommendation or guaranteed return.
#INTCB #CryptoLearning