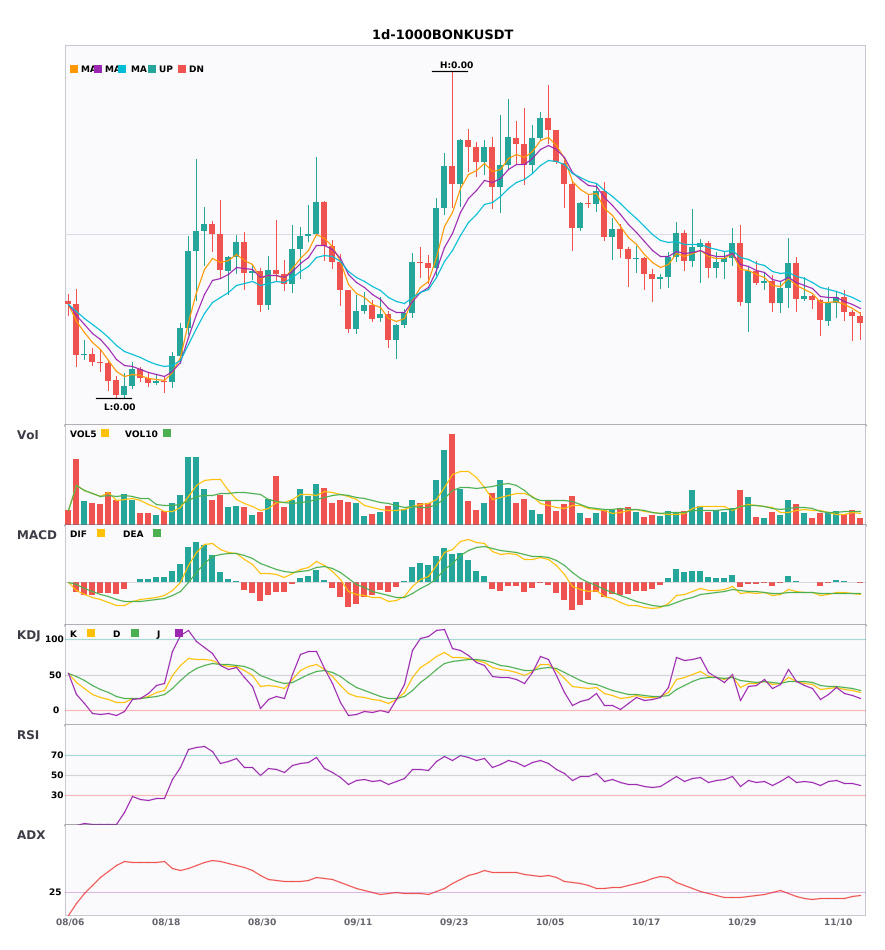
$1000BONK's daily chart remains bearish, with short-term pressure for now 🔥
════════════════════
🟢 $1000BONK Daily Chart Bearish Signal
⚠️Technical analysis: The ADX trend is just getting started and may be followed; the MACD bearish crossover signals a strong bearish push; moving averages are bearishly aligned and diverging downward; KDJ's K line crossing below D indicates weakness; trading volume is normal.
════════════════════
🔔 Follow for first-hand market updates 🔔
#技术分析 #1000BONK
📌 When trading, pay attention to whether the candlestick pattern confirms the setup.
════════════════════
🟢 $1000BONK Daily Chart Bearish Signal
⚠️Technical analysis: The ADX trend is just getting started and may be followed; the MACD bearish crossover signals a strong bearish push; moving averages are bearishly aligned and diverging downward; KDJ's K line crossing below D indicates weakness; trading volume is normal.
════════════════════
🔔 Follow for first-hand market updates 🔔
#技术分析 #1000BONK
📌 When trading, pay attention to whether the candlestick pattern confirms the setup.