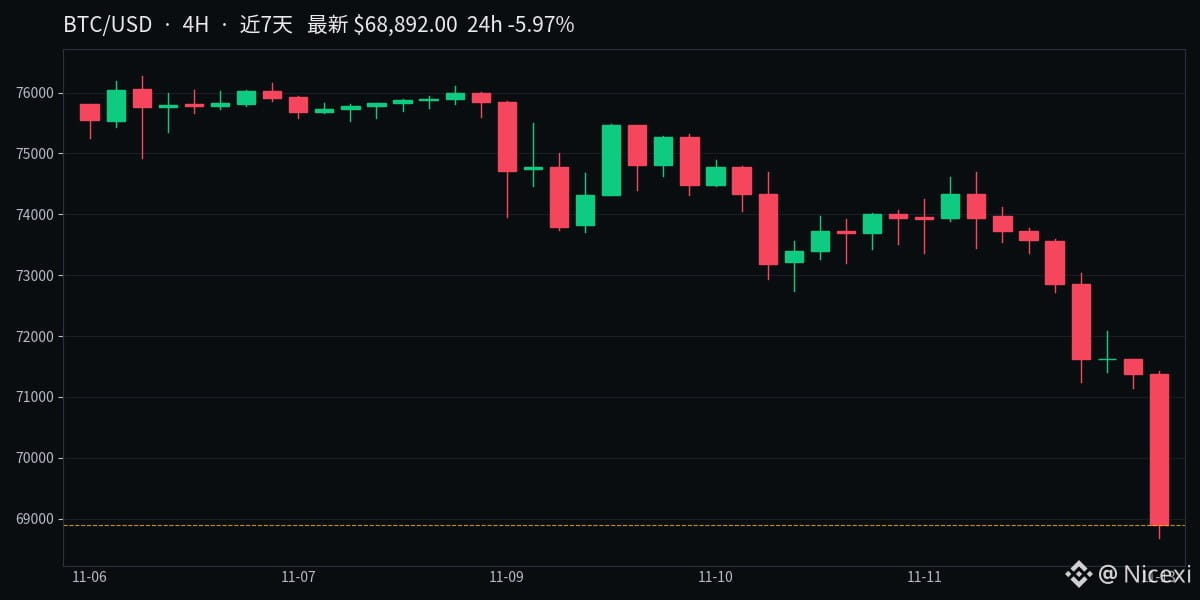
#比特币行情 $BTC Current price: 68,900, down 5.9% in 24 hours. This drop has been pretty sharp.
For the past few days, it had been moving sideways between 71,000 and 74,000. Today, it broke below the 70,000 mark on heavy volume. Technically, this is a breakdown from the trading range. Once the lower boundary at 70,000 gave way, more downside opened up.
The indicators are also overwhelmingly bearish: the moving averages are aligned bearishly, with MA7 at 72,000 and MA25 at 73,600, while the price is below both. The MACD histogram is at -398 and still expanding downward. RSI is only 16, which is deeply oversold. The only positive is that at this level of oversold conditions, a short-term rebound could come at any time.
Watch 68,675 below—that’s this week’s low. If it holds, there’s still room for the price to consolidate; if it doesn’t, it will have to look for support at lower levels. On the upside, watch 70,500 first, where the lower Bollinger Band sits. A move back above that level would be needed to signal that the decline has stopped.
For the past few days, it had been moving sideways between 71,000 and 74,000. Today, it broke below the 70,000 mark on heavy volume. Technically, this is a breakdown from the trading range. Once the lower boundary at 70,000 gave way, more downside opened up.
The indicators are also overwhelmingly bearish: the moving averages are aligned bearishly, with MA7 at 72,000 and MA25 at 73,600, while the price is below both. The MACD histogram is at -398 and still expanding downward. RSI is only 16, which is deeply oversold. The only positive is that at this level of oversold conditions, a short-term rebound could come at any time.
Watch 68,675 below—that’s this week’s low. If it holds, there’s still room for the price to consolidate; if it doesn’t, it will have to look for support at lower levels. On the upside, watch 70,500 first, where the lower Bollinger Band sits. A move back above that level would be needed to signal that the decline has stopped.