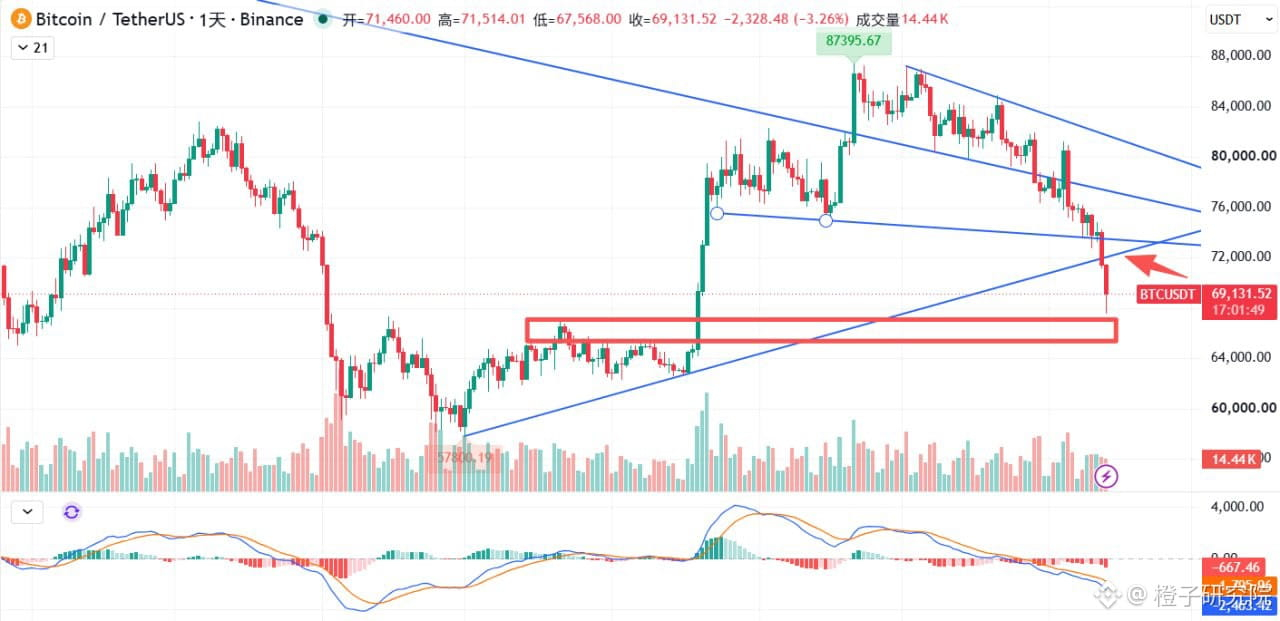
【 71800 becomes the dividing line between bulls and bears! Whether 66956–65500 holds will determine what happens next 】
Bitcoin didn’t play along this time. U.S. stocks stopped falling, but it went and crashed on its own—far more unexpectedly than I thought. Frustrating! But being wrong is being wrong. The market taught me a lesson, and I admit it. No need for excuses or explanations.
Now that it has broken below the 71800 uptrend channel, let’s take another look at the current market situation.
If it can’t get back above 71800 over the next couple of days—which looks quite likely—we can consider the rally from 57800 to 87395 over. What follows would be a daily-chart-level pullback.
To break it down further, price is now approaching the top of the previous rally, around 66956. First, let’s see how well the 66956–65500 range holds as support. If it holds and price rebounds back above 71800, that would be a normal pullback. But if price rebounds here and then falls back down, that would confirm the breakdown, and there could be much more room to fall. We might see a larger-scale retest, with price moving toward the 50,000 range.
Of course, there’s another possibility: price could accelerate downward and break straight through the 66956–65500 support zone. That’s the scenario I least want to see, as it would increase the likelihood of Bitcoin breaking below 57800 and making a new low in the future, forcing us to redraw the entire cycle…
Back to the strategy for now: I don’t recommend panic-selling here. Wait for a rebound toward 71800 before considering reducing your position—that’s the more likely scenario. Then adjust your approach based on how the market develops. Hang in there; if you’re going to reduce your position, do it after a bounce. Selling into this drop could mean throwing your coins away at the very bottom!
#BTC走势分析 $SOL #eth
Bitcoin didn’t play along this time. U.S. stocks stopped falling, but it went and crashed on its own—far more unexpectedly than I thought. Frustrating! But being wrong is being wrong. The market taught me a lesson, and I admit it. No need for excuses or explanations.
Now that it has broken below the 71800 uptrend channel, let’s take another look at the current market situation.
If it can’t get back above 71800 over the next couple of days—which looks quite likely—we can consider the rally from 57800 to 87395 over. What follows would be a daily-chart-level pullback.
To break it down further, price is now approaching the top of the previous rally, around 66956. First, let’s see how well the 66956–65500 range holds as support. If it holds and price rebounds back above 71800, that would be a normal pullback. But if price rebounds here and then falls back down, that would confirm the breakdown, and there could be much more room to fall. We might see a larger-scale retest, with price moving toward the 50,000 range.
Of course, there’s another possibility: price could accelerate downward and break straight through the 66956–65500 support zone. That’s the scenario I least want to see, as it would increase the likelihood of Bitcoin breaking below 57800 and making a new low in the future, forcing us to redraw the entire cycle…
Back to the strategy for now: I don’t recommend panic-selling here. Wait for a rebound toward 71800 before considering reducing your position—that’s the more likely scenario. Then adjust your approach based on how the market develops. Hang in there; if you’re going to reduce your position, do it after a bounce. Selling into this drop could mean throwing your coins away at the very bottom!
#BTC走势分析 $SOL #eth