NVIDIA at $165: Are you cutting your losses or picking up a bargain?
Jensen Huang suddenly resigns, and the stock plunges from $243 to $148 as trading volume explodes to 750 million shares. But just as everyone panics, someone quietly snaps up shares after hours, pushing the price to $167.8. Is this a golden buying opportunity—or catching a falling knife?
First, the big picture: It looks like the sky is falling, but the price hasn’t collapsed.
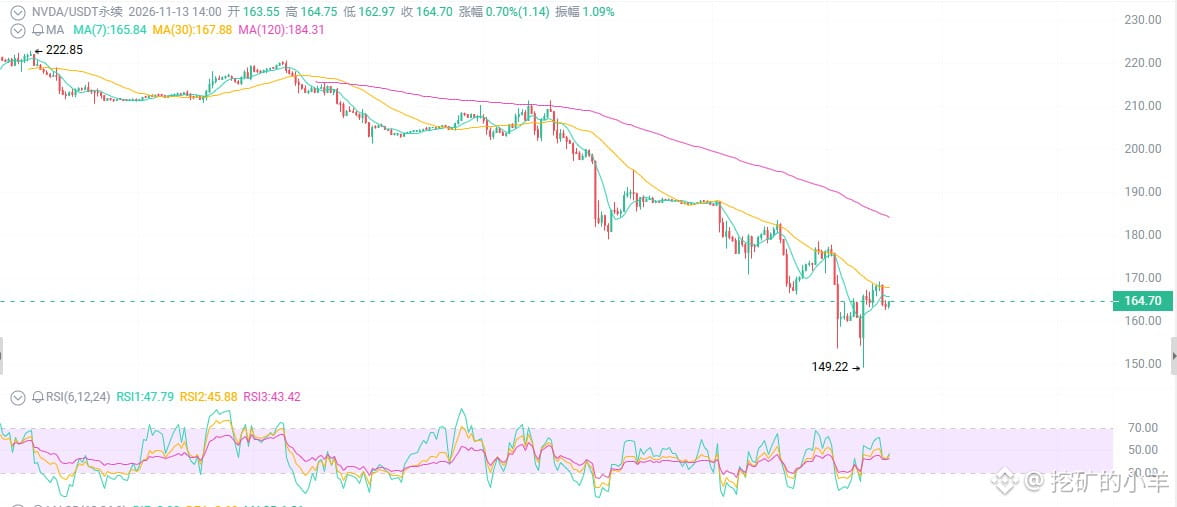
On November 12, NVIDIA’s board announced that Jensen Huang was stepping down immediately as CEO, president, and a director, citing two extramarital-affair scandals. The stock opened with a direct plunge to $148.80, a 52-week low, and then—bounced all the way back to close near $166, before rising further after hours to $167.8.
Trading volume hit 740 to 750 million shares, several times the usual level.
First: Jensen Huang is gone, but CUDA isn’t
“The founder left, so NVIDIA is finished.” Wake up.
NVIDIA’s TTM revenue is $303 billion, net income is $193 billion, and EPS is $7.91. Its data center business remains dominant, Blackwell and Vera Rubin platforms are ramping up, and gross margins are 73% to 75%. Q3 revenue guidance is $108 billion ±2%, and FY2028 growth guidance is 70%.
Jensen Huang is the company’s soul—that’s true. But NVIDIA’s moat is the CUDA ecosystem, tens of thousands of engineers, and orders from Microsoft, Google, and Amazon—not one person’s affair.
Second: Have you ever seen NVIDIA at 13x earnings?
Its current market cap is $4.0 to $4.1 trillion, with a P/E of about 21x and a forward P/E of just 13x to 14x.
NVIDIA’s P/E peaked at over 200x in 2023, and was still 60x to 80x in 2024. A forward P/E of 13x to 14x for an AI leader growing revenue by 70% with a 75% gross margin—
That’s not a valuation. That’s a clearance sale.
The average analyst price target is still in the $280 to $310 range. Even a downgrade to $185 would put it 12% above the current price of $165. Most institutions maintain a Buy rating.
Third: The technical chart is showing a textbook “panic bottom”
The November 12 candle had a low of $148.80, closed near $166, and showed a long lower wick on explosive volume.
An event-driven shakeout. Panic sellers were flushed out in one go around $148, and buying support was extremely strong. RSI has entered oversold territory, and although MACD remains bearish, signs of divergence are emerging.
Short-term support: $148 to $150. Below that, $140 to $145 is the second line of defense.
Resistance: $170 to $175, then $180 to $185; $200 is a psychological threshold.
If it can hold above $170 before earnings, a rebound to $200 is no dream. If it breaks below $148, look for $140.
Jensen Huang suddenly resigns, and the stock plunges from $243 to $148 as trading volume explodes to 750 million shares. But just as everyone panics, someone quietly snaps up shares after hours, pushing the price to $167.8. Is this a golden buying opportunity—or catching a falling knife?
First, the big picture: It looks like the sky is falling, but the price hasn’t collapsed.
On November 12, NVIDIA’s board announced that Jensen Huang was stepping down immediately as CEO, president, and a director, citing two extramarital-affair scandals. The stock opened with a direct plunge to $148.80, a 52-week low, and then—bounced all the way back to close near $166, before rising further after hours to $167.8.
Trading volume hit 740 to 750 million shares, several times the usual level.
First: Jensen Huang is gone, but CUDA isn’t
“The founder left, so NVIDIA is finished.” Wake up.
NVIDIA’s TTM revenue is $303 billion, net income is $193 billion, and EPS is $7.91. Its data center business remains dominant, Blackwell and Vera Rubin platforms are ramping up, and gross margins are 73% to 75%. Q3 revenue guidance is $108 billion ±2%, and FY2028 growth guidance is 70%.
Jensen Huang is the company’s soul—that’s true. But NVIDIA’s moat is the CUDA ecosystem, tens of thousands of engineers, and orders from Microsoft, Google, and Amazon—not one person’s affair.
Second: Have you ever seen NVIDIA at 13x earnings?
Its current market cap is $4.0 to $4.1 trillion, with a P/E of about 21x and a forward P/E of just 13x to 14x.
NVIDIA’s P/E peaked at over 200x in 2023, and was still 60x to 80x in 2024. A forward P/E of 13x to 14x for an AI leader growing revenue by 70% with a 75% gross margin—
That’s not a valuation. That’s a clearance sale.
The average analyst price target is still in the $280 to $310 range. Even a downgrade to $185 would put it 12% above the current price of $165. Most institutions maintain a Buy rating.
Third: The technical chart is showing a textbook “panic bottom”
The November 12 candle had a low of $148.80, closed near $166, and showed a long lower wick on explosive volume.
An event-driven shakeout. Panic sellers were flushed out in one go around $148, and buying support was extremely strong. RSI has entered oversold territory, and although MACD remains bearish, signs of divergence are emerging.
Short-term support: $148 to $150. Below that, $140 to $145 is the second line of defense.
Resistance: $170 to $175, then $180 to $185; $200 is a psychological threshold.
If it can hold above $170 before earnings, a rebound to $200 is no dream. If it breaks below $148, look for $140.