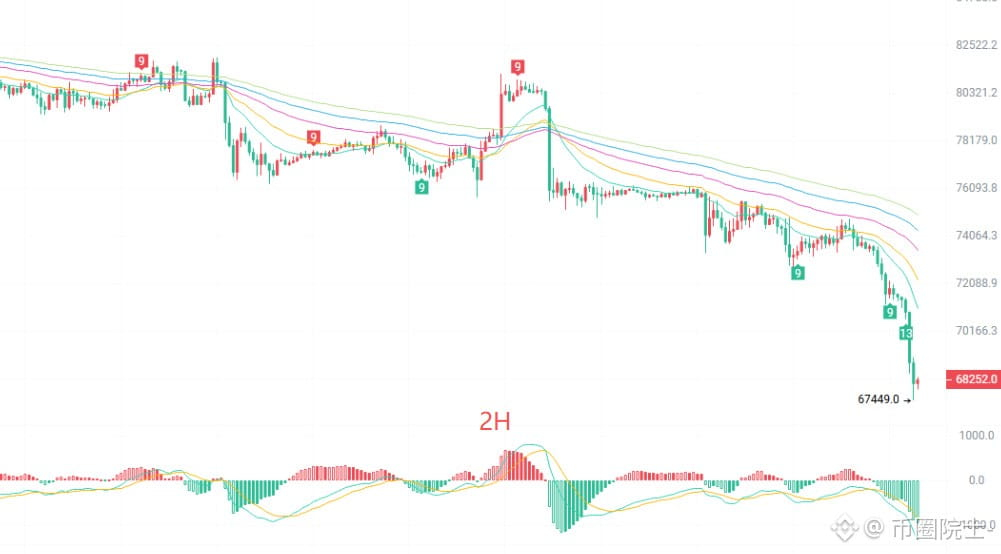
$BTC BTC. One-line summary of this move: bears are applying pressure, and every bounce by the bulls is just another step down.
On the 2-hour chart, the price has fallen below several moving averages, with the short- and medium-term averages fanning downward. MACD continues to print green bars below the zero line, the Bollinger Bands are opening downward, and the price is hugging the lower band. Bounce highs are stepping lower, and the broader bearish structure remains unchanged. The small bullish candle recovering from the current low is just a brief rebound after a sharp drop—not a reversal.
On the 15-minute chart, short-term highs and lows continue to move lower, while layers of short-term moving averages cap the price from above. The MACD green bars have not fully contracted, and bounce volume is weak. The slight uptick after being oversold is a technical rebound; whether it can continue depends on whether the price can move above the cluster of moving averages.
Key levels:
Bearish: Try shorting at 69000–69400, with a stop-loss above 69700. Targets: 67800 and 67449.
Short-term bullish: Try a rebound long at 67800–67450, with a stop-loss below 67200. Targets: 68800 and 69200.
Don't try to force a bottom in a weak market. Treat long positions as rebound trades only; short positions are more aligned with the trend. Set stop-losses in advance, keep position sizes small, and don't hold losing trades or average down.
#BTC走势分析
On the 2-hour chart, the price has fallen below several moving averages, with the short- and medium-term averages fanning downward. MACD continues to print green bars below the zero line, the Bollinger Bands are opening downward, and the price is hugging the lower band. Bounce highs are stepping lower, and the broader bearish structure remains unchanged. The small bullish candle recovering from the current low is just a brief rebound after a sharp drop—not a reversal.
On the 15-minute chart, short-term highs and lows continue to move lower, while layers of short-term moving averages cap the price from above. The MACD green bars have not fully contracted, and bounce volume is weak. The slight uptick after being oversold is a technical rebound; whether it can continue depends on whether the price can move above the cluster of moving averages.
Key levels:
Bearish: Try shorting at 69000–69400, with a stop-loss above 69700. Targets: 67800 and 67449.
Short-term bullish: Try a rebound long at 67800–67450, with a stop-loss below 67200. Targets: 68800 and 69200.
Don't try to force a bottom in a weak market. Treat long positions as rebound trades only; short positions are more aligned with the trend. Set stop-losses in advance, keep position sizes small, and don't hold losing trades or average down.
#BTC走势分析