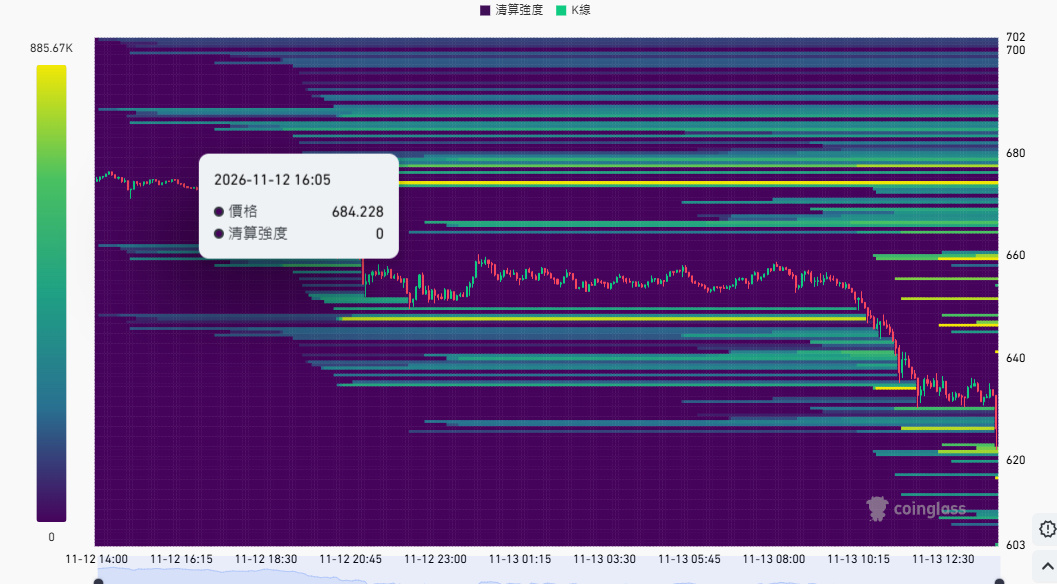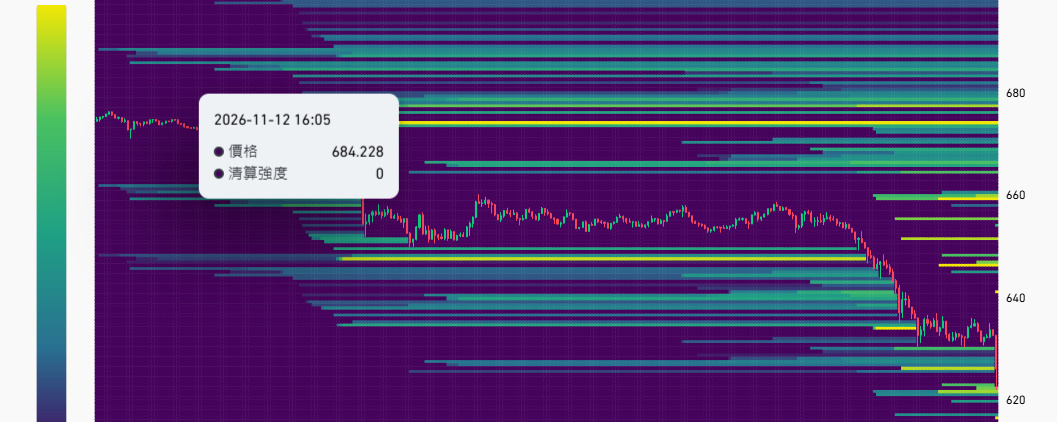

Bro, even a sharp drop can be an opportunity—it’s all about how you play it. This is BNB’s liquidation heatmap.
【Market Recap】
Look at the 24-hour liquidation levels: 650 and 640. Long positions were repeatedly liquidated in clusters here, triggering a cascade downward.
【Support below (long zone)】
There could be another wave of liquidations around 620, but the amount of capital involved is small (about 660k), not enough to trigger a large-scale cascade. This means there isn’t much liquidation liquidity left to fuel a move down, so the potential for a sharp crash is limited. If you’re going long, keep a close eye on 620 as a key support level, but there’s no need to get overly anxious.
【Overhead resistance (short zone)】
Watch the area above! Around 640, 660, and 670, short positions are likely to be liquidated. Because
there’s a dense cluster of short-position fuel above, a sharp short squeeze could very well happen here. If you’re holding shorts opened at higher prices, stay extremely alert when it reaches 660—be careful not to get caught in the squeeze.
【How to read the heatmap】
Those bright yellow horizontal lines near the bottom of the chart (640, 630, 620) aren’t support levels—they’re “traps” the bulls have dug for themselves.
Purple = very low liquidation intensity;
Blue → green → yellow = dense liquidation zones (areas with a high risk of mass liquidations).
Each horizontal line on the chart represents the estimated liquidation price for a group of leveraged positions; when the price hits that line, those positions will be liquidated immediately.
Heroes emerge in turbulent times—cherish every step along the way. In the current market, both bulls and bears are walking a tightrope.