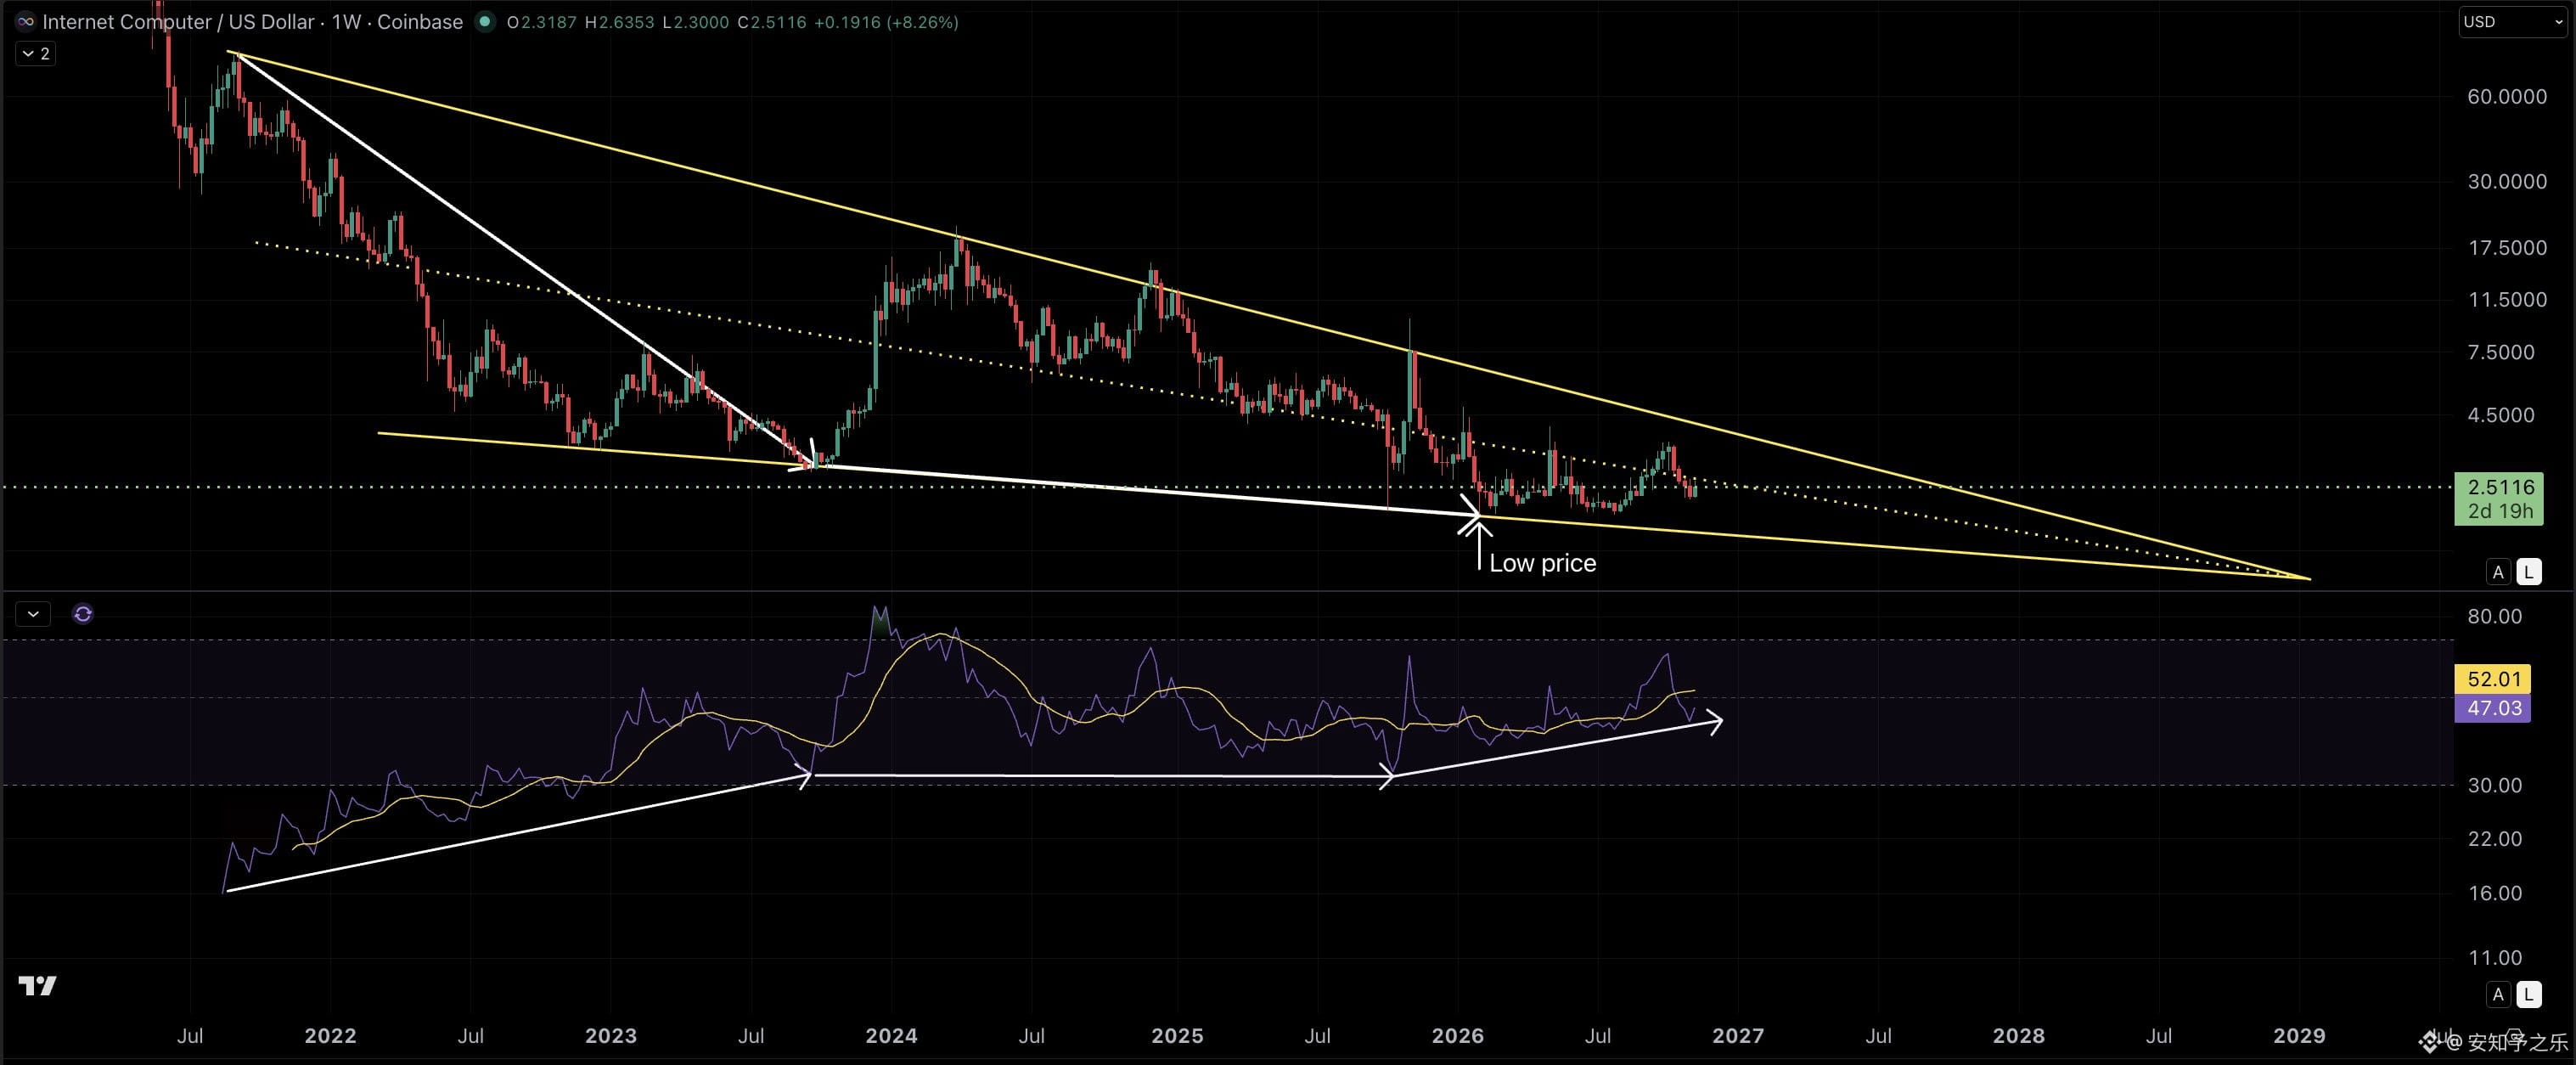
Compare the weekly price action of $ICP with the higher-timeframe RSI, and the signal on this chart is crystal clear.
The price kept falling within a descending wedge, with especially sharp declines early on. But the RSI formed a bullish divergence, rising in the opposite direction to the price. As the price continued to bottom out, the indicator temporarily flattened. Now that the price is gradually stabilizing, the RSI is turning upward again.
Taking a longer-term view, the RSI and price have maintained this bullish divergence for more than five years.
In short, smart money has been quietly accumulating! Once this asset takes off, its upside potential could be substantial.
The price kept falling within a descending wedge, with especially sharp declines early on. But the RSI formed a bullish divergence, rising in the opposite direction to the price. As the price continued to bottom out, the indicator temporarily flattened. Now that the price is gradually stabilizing, the RSI is turning upward again.
Taking a longer-term view, the RSI and price have maintained this bullish divergence for more than five years.
In short, smart money has been quietly accumulating! Once this asset takes off, its upside potential could be substantial.