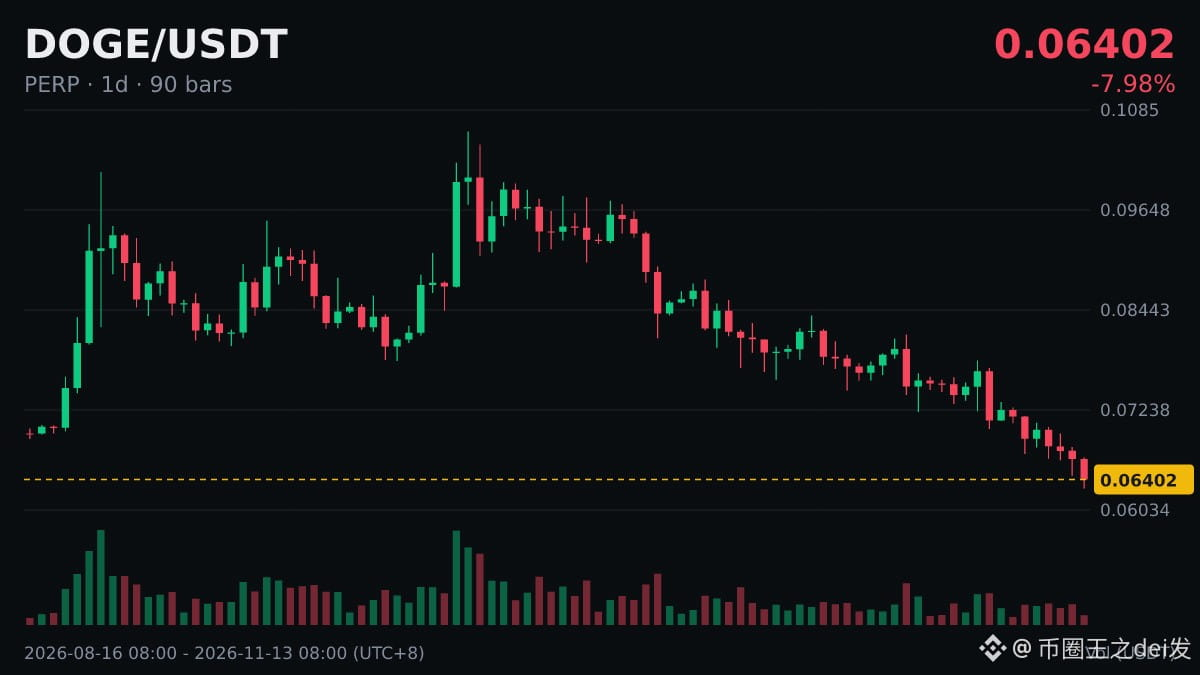
🔢 Data: $DOGE |Daily RSI(14) 24.8|Oversold
· Definition: When Wilder first introduced RSI, it was intended for futures markets. Today, almost every charting tool includes it.
· How to read it: Many people pay closer attention to the moment RSI exits the overbought or oversold zone—for example, dropping back below 70 after rising above it—rather than trading against the trend as soon as it enters the zone.
Don't let a single indicator throw your plan off track, and don't use borrowed money to test a hypothesis.
· Definition: When Wilder first introduced RSI, it was intended for futures markets. Today, almost every charting tool includes it.
· How to read it: Many people pay closer attention to the moment RSI exits the overbought or oversold zone—for example, dropping back below 70 after rising above it—rather than trading against the trend as soon as it enters the zone.
Don't let a single indicator throw your plan off track, and don't use borrowed money to test a hypothesis.