The candlestick chart is drawing an ECG again—the low-blood-sugar kind.
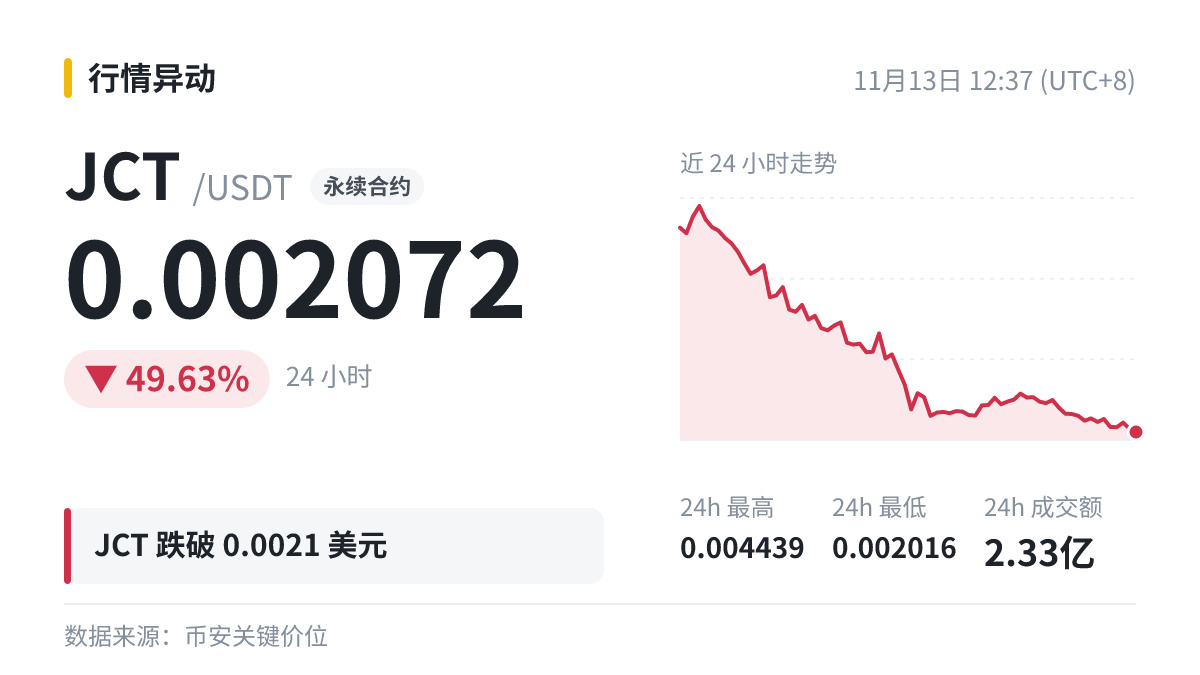
($JCT has fallen below the 0.0021 level.)
It’s been below that level for a while and still hasn’t recovered, which suggests there’s considerable selling pressure overhead. Take this seriously.
($JCT has fallen below the 0.0021 level.)
It’s been below that level for a while and still hasn’t recovered, which suggests there’s considerable selling pressure overhead. Take this seriously.