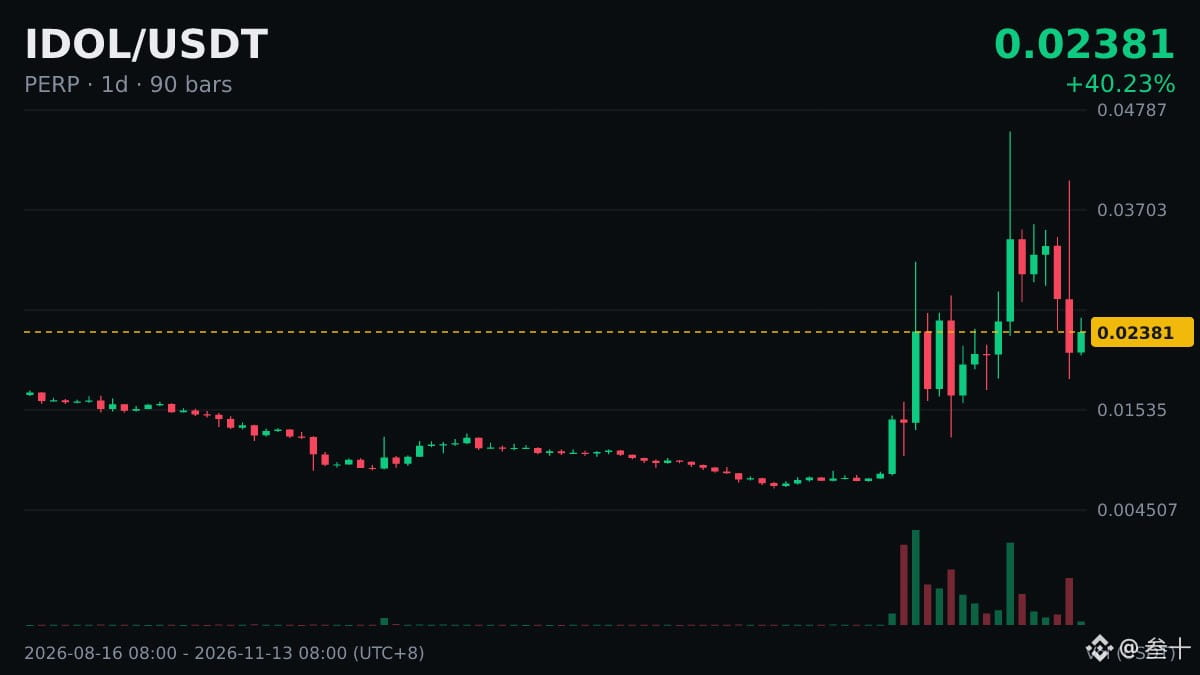
🐋 $IDOL On the daily chart, MACD forms a death cross above the zero line.
There are cross signals all over the screen; what really matters is where the cross occurs and what the trend was before it.
The zero line is the line where DIF equals 0, meaning the 12-period EMA and 26-period EMA overlap. When DIF is above the zero line, the short-term moving average is above the long-term moving average.
Many people also look for bearish and bullish divergences: when the price makes a new high but MACD fails to follow, or the price makes a new low but MACD fails to follow, this is often seen as a sign of weakening momentum.
Before trading with leverage, first consider whether you can handle the worst-case outcome, then see what the indicators say.
There are cross signals all over the screen; what really matters is where the cross occurs and what the trend was before it.
The zero line is the line where DIF equals 0, meaning the 12-period EMA and 26-period EMA overlap. When DIF is above the zero line, the short-term moving average is above the long-term moving average.
Many people also look for bearish and bullish divergences: when the price makes a new high but MACD fails to follow, or the price makes a new low but MACD fails to follow, this is often seen as a sign of weakening momentum.
Before trading with leverage, first consider whether you can handle the worst-case outcome, then see what the indicators say.