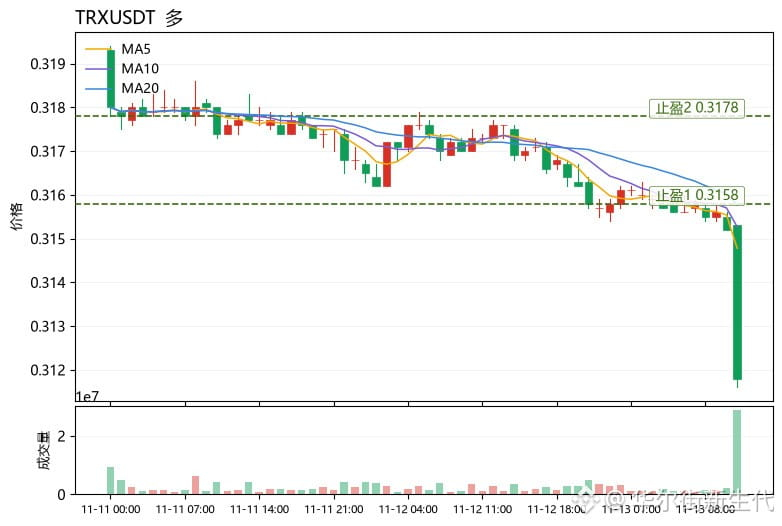
$TRX Current price 0.3118, 24h -1.76%, trading volume 24.5M USDT; MA5 at 0.31478 has crossed below MA20 at 0.315765, RSI is just 14.0, indicating extreme oversold conditions, and the MACD histogram at -0.000248 remains bearish. The Bollinger Bands are [0.313733, 0.317797], and the current price has fallen below the lower band, while the funding rate of -0.0199% shows that shorts are paying to hold their positions. The Fear and Greed Index is 20, indicating extreme fear.
Assessment: This is a crowded short position, not an accelerating trend. With the price below the lower band and RSI at 14, a short-term spike-and-recovery is likely; the negative funding rate means the cost of leveraged short positions is rising, so any sign of a bottom could trigger short covering. The outlook is bullish: trade an oversold bounce rather than chase the trend.
Entry reference: 0.3090–0.3120 (spike zone outside the lower band; extremely oversold RSI provides a margin of safety); Take-profit 1: 0.3158 (near MA20 and the middle Bollinger Band, the first target as the negative funding rate converges); Take-profit 2: 0.3178 (upper Bollinger Band; requires the MACD histogram to narrow in tandem); Stop-loss: 0.3055 (a break below the previous low invalidates the oversold thesis; avoid the risk of long liquidations under negative funding).
Also watching: $SPCXB, $QQQB. Both are above MA20 and outperforming TRX, with QQQB's MACD turning bullish, giving it stronger relative momentum.
(Personal opinion for reference only; this is not investment advice. Contracts involve extremely high risk; please manage position size carefully.)
【Data】
Symbol: TRXUSDT
Direction: Long
Entry: 0.3090-0.3120
Take-profit 1: 0.3158
Take-profit 2: 0.3178
Stop-loss: 0.3055
Assessment: This is a crowded short position, not an accelerating trend. With the price below the lower band and RSI at 14, a short-term spike-and-recovery is likely; the negative funding rate means the cost of leveraged short positions is rising, so any sign of a bottom could trigger short covering. The outlook is bullish: trade an oversold bounce rather than chase the trend.
Entry reference: 0.3090–0.3120 (spike zone outside the lower band; extremely oversold RSI provides a margin of safety); Take-profit 1: 0.3158 (near MA20 and the middle Bollinger Band, the first target as the negative funding rate converges); Take-profit 2: 0.3178 (upper Bollinger Band; requires the MACD histogram to narrow in tandem); Stop-loss: 0.3055 (a break below the previous low invalidates the oversold thesis; avoid the risk of long liquidations under negative funding).
Also watching: $SPCXB, $QQQB. Both are above MA20 and outperforming TRX, with QQQB's MACD turning bullish, giving it stronger relative momentum.
(Personal opinion for reference only; this is not investment advice. Contracts involve extremely high risk; please manage position size carefully.)
【Data】
Symbol: TRXUSDT
Direction: Long
Entry: 0.3090-0.3120
Take-profit 1: 0.3158
Take-profit 2: 0.3178
Stop-loss: 0.3055