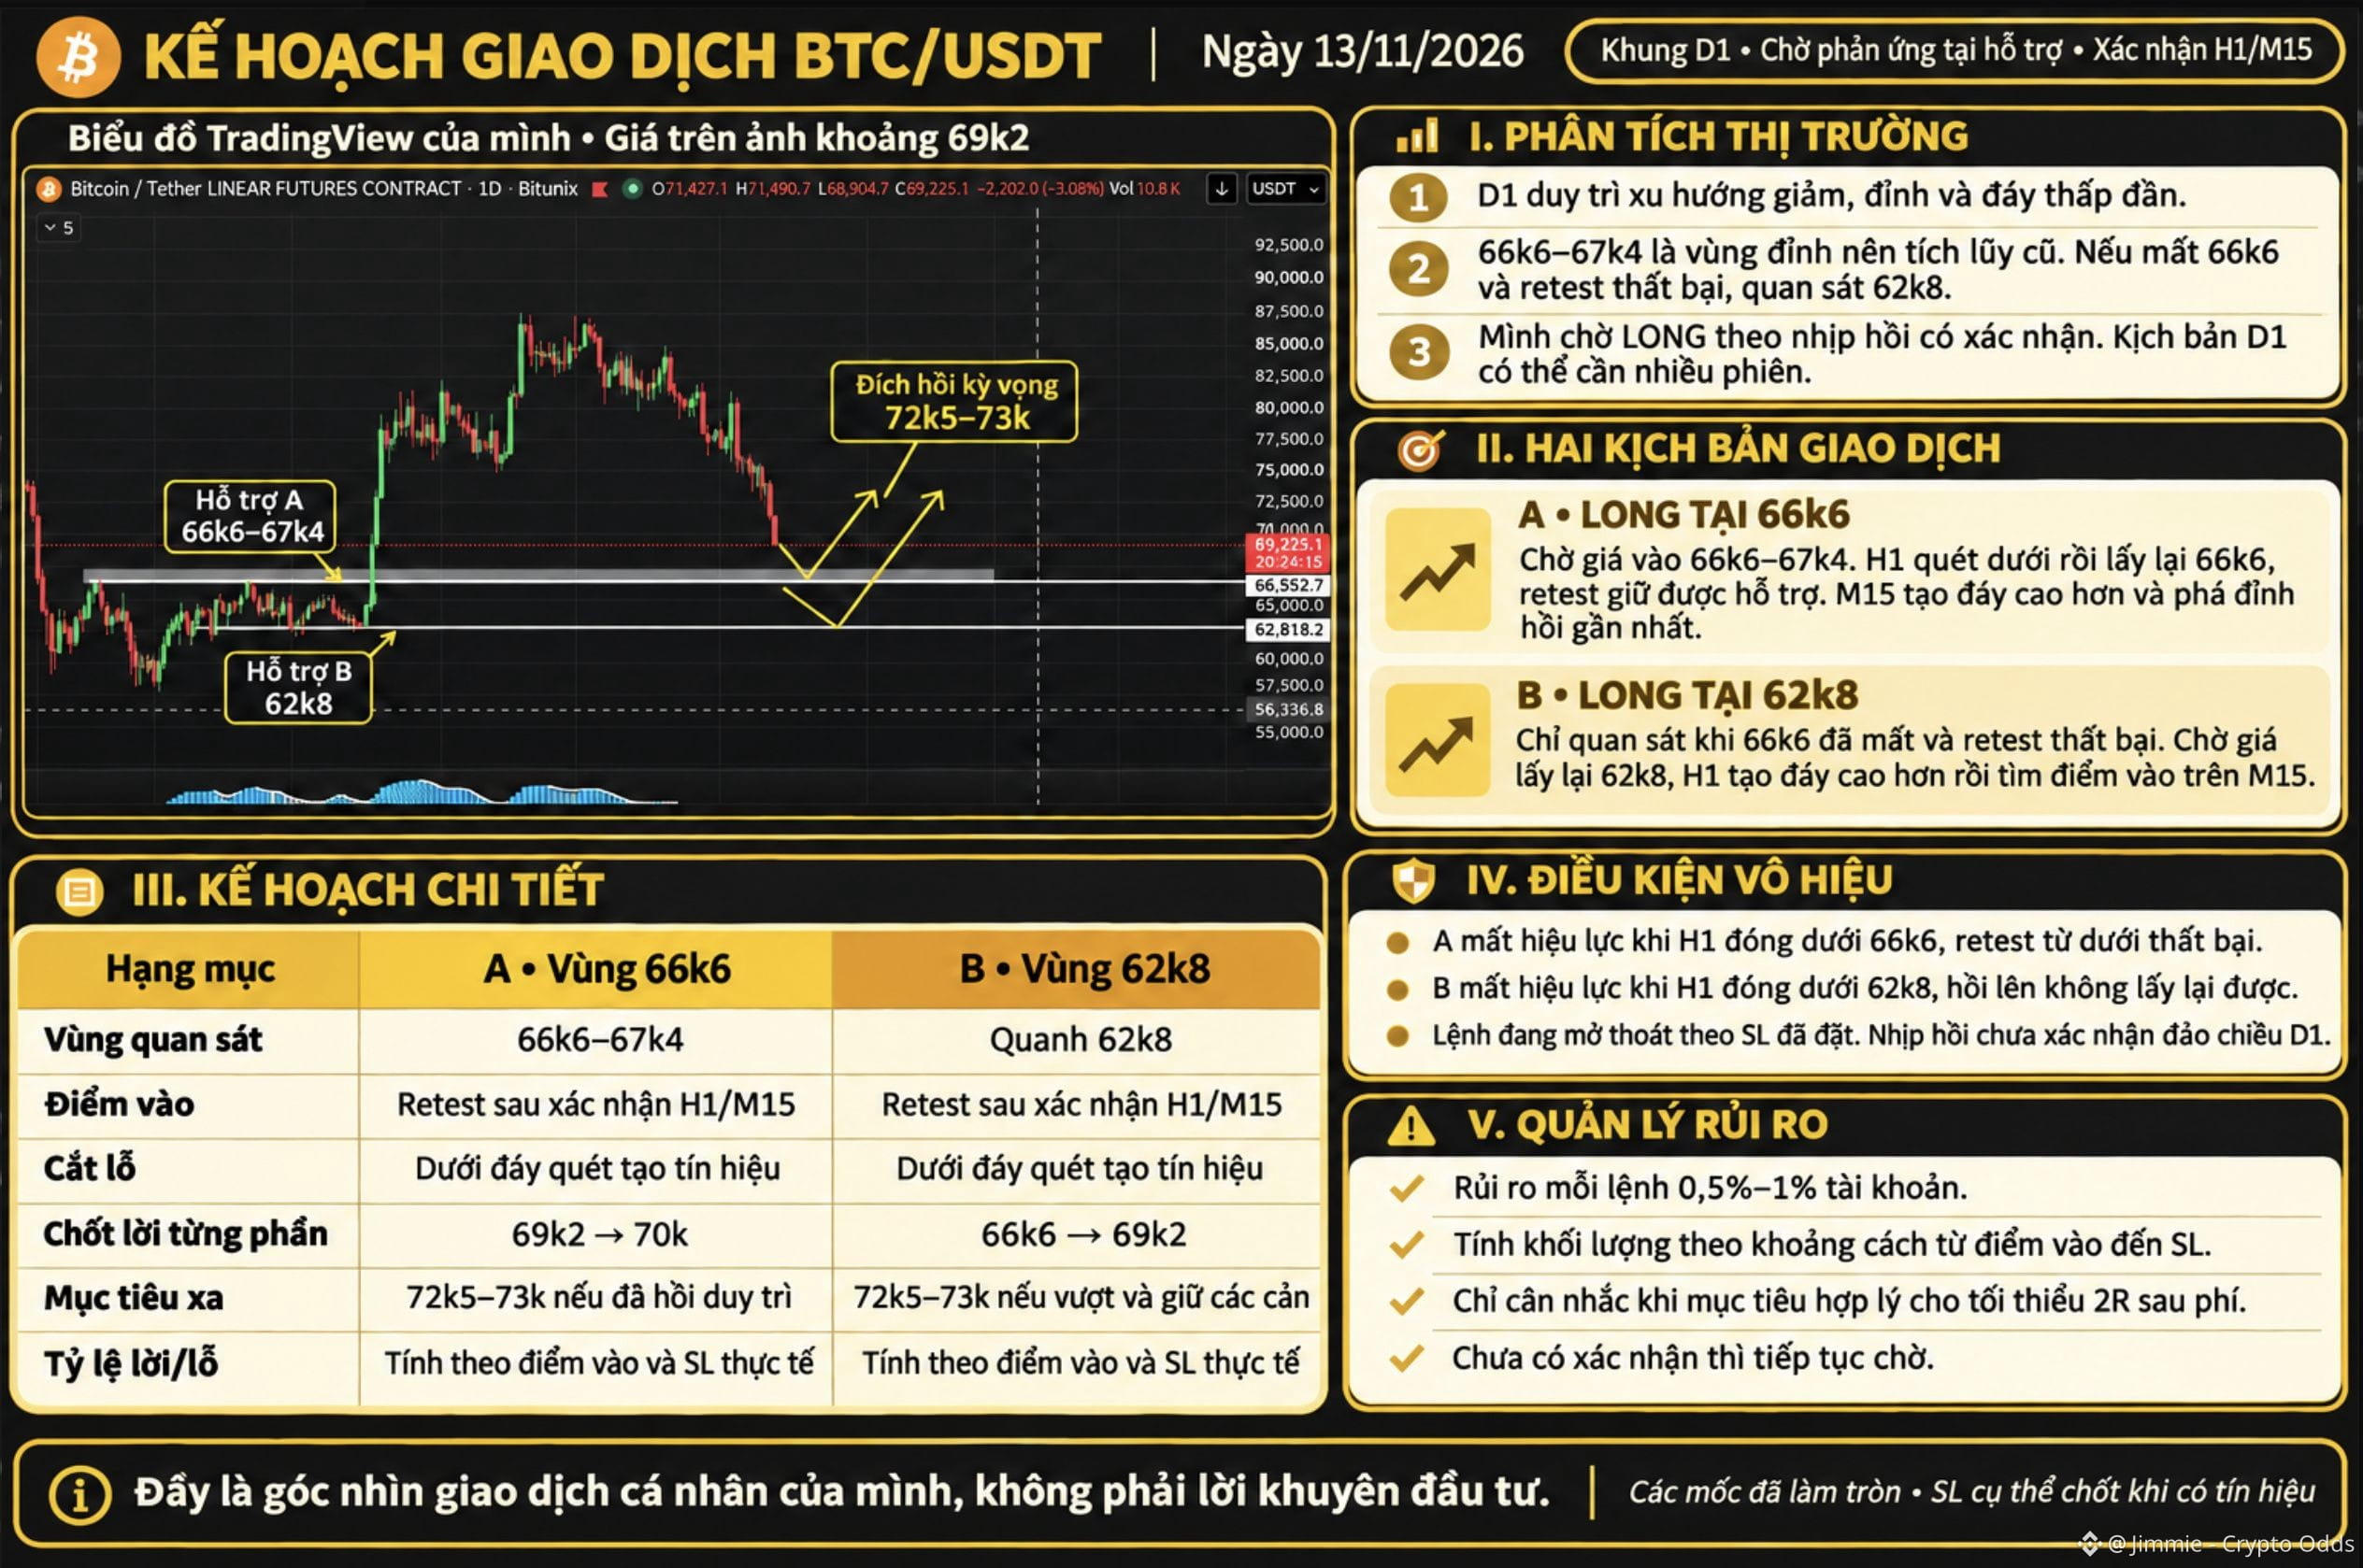
BTC on the D1 timeframe is still maintaining a bearish structure, with each successive high and low getting lower. The price in the image is around 69k2 and is moving toward the support zones below. I expect a bounce at the marked zones, but the price needs to show an actual reaction to confirm it.
The first support zone is around 66k6–67k4, with 66k6 as the key level. This is the former range high before the strong rally. If this zone is breached and the price fails to reclaim it, the next support I’m watching is 62k8, near the low of the previous consolidation range.
The rebound target indicated by the arrow on the chart is around 72k5–73k. Since the chart is on the daily timeframe, this scenario may take several sessions to play out.
Scenario A · Wait for a LONG at 66k6
I’ll wait for BTC to reach the 66k6–67k4 zone, then observe the price on H1. If the price sweeps below 66k6 but closes back above it, then holds this zone on a retest, I’ll look for a long entry on M15.
The entry signal is a higher low followed by a break above the most recent rebound high. The signal will be clearer if rising volume accompanies the bullish candle and the retest holds support.
Scenario B · Wait for a LONG lower down at 62k8
If BTC loses 66k6, then rallies to test it but fails to reclaim it, I’ll shift my focus to 62k8.
Here, I’ll continue to wait for the price to stop falling, print a candle with a long lower wick, and reclaim 62k8 after the sweep. Once H1 forms a higher low, I’ll move to M15 to look for an entry. The price reaching the support zone is only the first step.
The first support zone is around 66k6–67k4, with 66k6 as the key level. This is the former range high before the strong rally. If this zone is breached and the price fails to reclaim it, the next support I’m watching is 62k8, near the low of the previous consolidation range.
The rebound target indicated by the arrow on the chart is around 72k5–73k. Since the chart is on the daily timeframe, this scenario may take several sessions to play out.
Scenario A · Wait for a LONG at 66k6
I’ll wait for BTC to reach the 66k6–67k4 zone, then observe the price on H1. If the price sweeps below 66k6 but closes back above it, then holds this zone on a retest, I’ll look for a long entry on M15.
The entry signal is a higher low followed by a break above the most recent rebound high. The signal will be clearer if rising volume accompanies the bullish candle and the retest holds support.
Scenario B · Wait for a LONG lower down at 62k8
If BTC loses 66k6, then rallies to test it but fails to reclaim it, I’ll shift my focus to 62k8.
Here, I’ll continue to wait for the price to stop falling, print a candle with a long lower wick, and reclaim 62k8 after the sweep. Once H1 forms a higher low, I’ll move to M15 to look for an entry. The price reaching the support zone is only the first step.