Fourth Test of Progressive Demand Zone: INIT Returns to 0.11–0.12 USD Floor on 4H, Ready for an Explosive Surge to 0.50 USD?
Traders hunting for repeatable historical market structures with asymmetric risk-to-reward ratios need to examine INIT on the 4H chart right now! Following a steep profit-taking pullback from near 0.40 USD back to its origin, price action has arrived at a high-conviction inflection zone for the fourth time.
Let's dissect the striking progression printed directly on the tape:
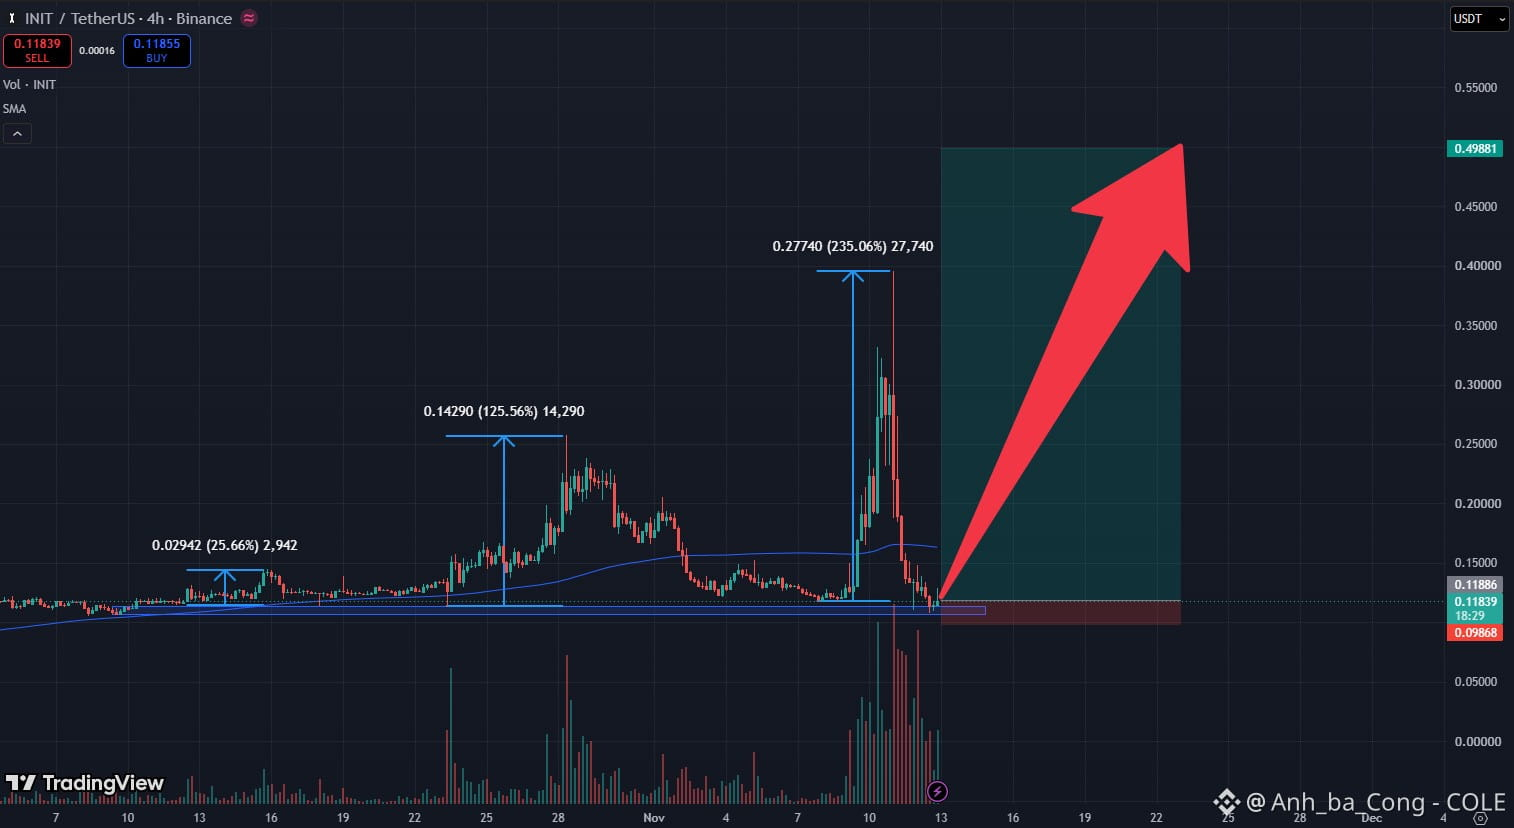
Touch 1 (Mid-October): Price rebounded off the 0.11 USD shelf for a clean 25.66% move.
Touch 2 (Late October): From the exact same demand box, INIT surged an impressive 125.56%.
Touch 3 (Early November): Price launched vertically for a massive 235.06% expansion wave!
Present Setup: INIT has landed squarely back at 0.11839 USD (highlighted blue accumulation zone) to test this structural launchpad a fourth time!
What is the tape telling us? Each revisit into the 0.11 – 0.12 USD pocket has attracted aggressive institutional accumulation capable of driving exponentially larger markup waves. Current 4H candles show downward velocity halting cleanly as selling volume fades. If this cyclical pattern holds across the broader market, a fourth expansion wave carries substantial upside potential!
Actionable execution blueprint:
Position: Demand-shelf Long entry around 0.1120 – 0.1190 USD.
Take-Profit Target (TP): Major psychological round-number milestone at 0.49881 USD (over 320% upside potential).
Protective Stop-Loss (SL): 0.09868 USD (safely positioned below the support box and 0.10 USD psychological floor).
Risk-to-Reward Ratio: Exceptional asymmetry, risking roughly 0.0197 points to capture an expansive 0.380+ point rally!
What is your take on INIT's historic demand zone? Will this fourth touch spark an explosive rally toward 0.50 USD, or do you expect extended sideways consolidation first? Share your perspective in the comments below!
DYOR $INIT #INIT
Traders hunting for repeatable historical market structures with asymmetric risk-to-reward ratios need to examine INIT on the 4H chart right now! Following a steep profit-taking pullback from near 0.40 USD back to its origin, price action has arrived at a high-conviction inflection zone for the fourth time.
Let's dissect the striking progression printed directly on the tape:
Touch 1 (Mid-October): Price rebounded off the 0.11 USD shelf for a clean 25.66% move.
Touch 2 (Late October): From the exact same demand box, INIT surged an impressive 125.56%.
Touch 3 (Early November): Price launched vertically for a massive 235.06% expansion wave!
Present Setup: INIT has landed squarely back at 0.11839 USD (highlighted blue accumulation zone) to test this structural launchpad a fourth time!
What is the tape telling us? Each revisit into the 0.11 – 0.12 USD pocket has attracted aggressive institutional accumulation capable of driving exponentially larger markup waves. Current 4H candles show downward velocity halting cleanly as selling volume fades. If this cyclical pattern holds across the broader market, a fourth expansion wave carries substantial upside potential!
Actionable execution blueprint:
Position: Demand-shelf Long entry around 0.1120 – 0.1190 USD.
Take-Profit Target (TP): Major psychological round-number milestone at 0.49881 USD (over 320% upside potential).
Protective Stop-Loss (SL): 0.09868 USD (safely positioned below the support box and 0.10 USD psychological floor).
Risk-to-Reward Ratio: Exceptional asymmetry, risking roughly 0.0197 points to capture an expansive 0.380+ point rally!
What is your take on INIT's historic demand zone? Will this fourth touch spark an explosive rally toward 0.50 USD, or do you expect extended sideways consolidation first? Share your perspective in the comments below!
DYOR $INIT #INIT