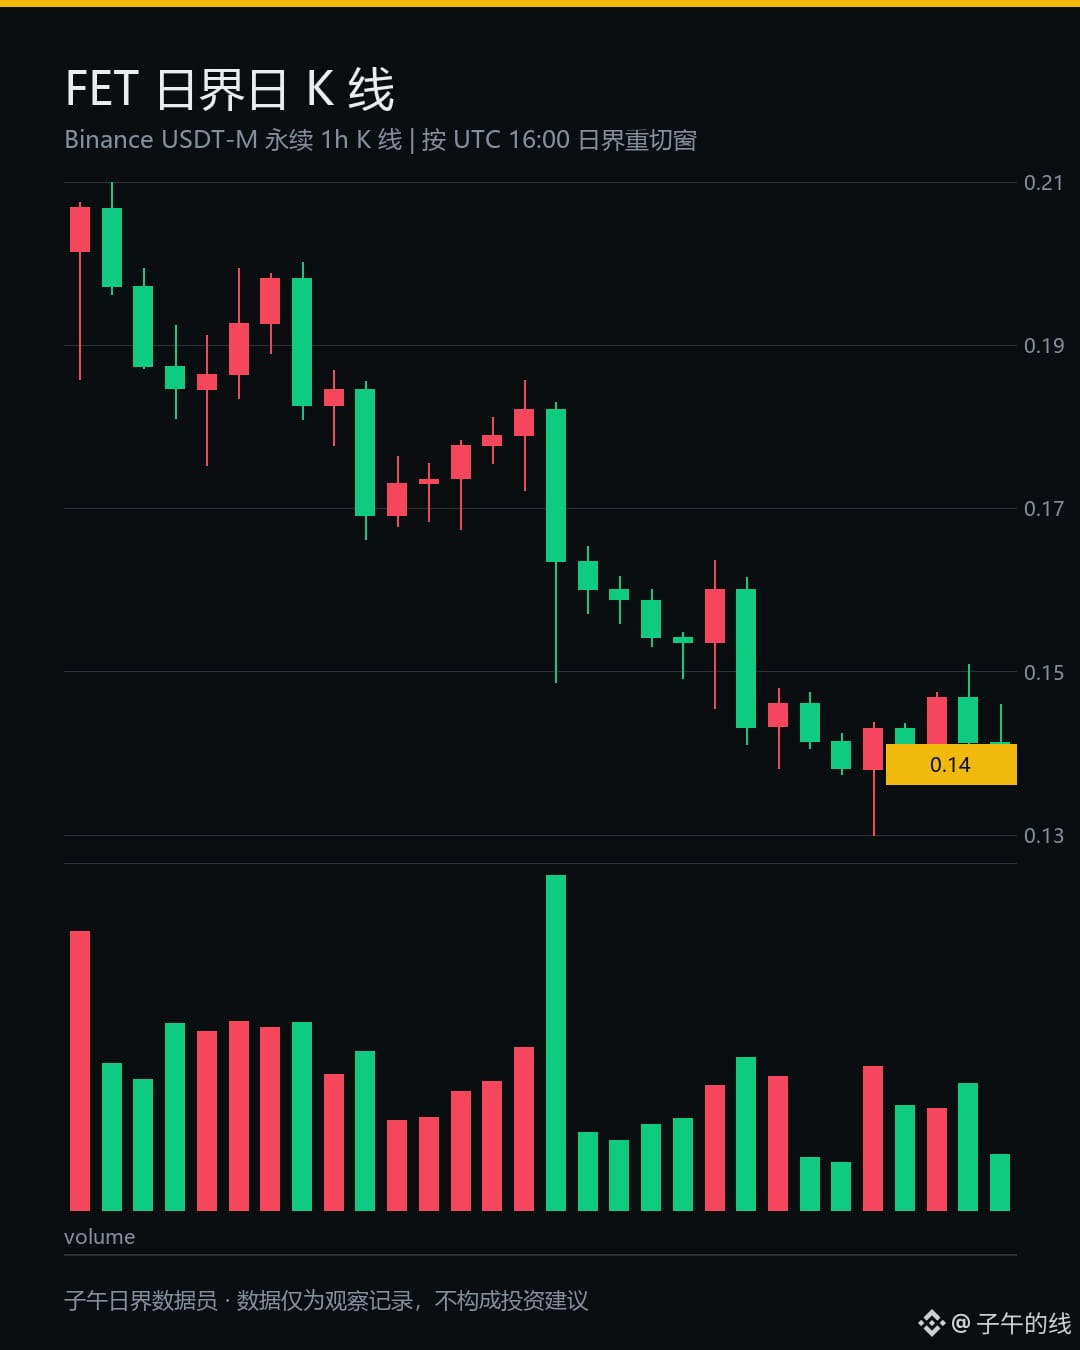
At first glance, I thought it hadn't moved much. $FET Stretch the window and it's a different story.
On October 28, it was at 0.1847, still up 1.97% over 24 hours. It looked calm.
I only saw the bigger picture after stretching the window from one day to seven, then to thirty. That green candle didn't point in any direction at all—it was just a brief pause in the downtrend.
Seven days: -6.85%. Thirty days: -17.14%.
I had to check those numbers twice before I believed them.
I looked at a few sources. Here's my synthesis.
The market isn't small, but liquidity is shallow.
It's still down -94.65% from its all-time high, and 85.16% of the supply is already circulating.
The remaining unlock schedule is like a reservoir that's run dry, with the bottom full of tokens waiting to be sold.
My position that day felt awkward: the 10-day range was 0.1693 to 0.2024, and the current price sat at the 47.13th percentile.
Right in the middle.
There's never a shortage of narratives around this token. What's missing is buying support.
The range is absurdly tight, funding is +0.0029%, neither longs nor shorts are dominating, and leverage is piled up on both sides.
At this level, I'll keep an eye on it, but I won't pay it more attention.
Honestly, the middle is the costliest place to be. It gives no one a clear reason to think they're wrong.
$BTC $ETH
#FET #比特币 #Cryptocurrency
I'm sure someone in the comments will say this sideways action is a buildup. What do you all think?
The above is a personal record of my trading system and observations of data, and does not constitute investment advice.
On October 28, it was at 0.1847, still up 1.97% over 24 hours. It looked calm.
I only saw the bigger picture after stretching the window from one day to seven, then to thirty. That green candle didn't point in any direction at all—it was just a brief pause in the downtrend.
Seven days: -6.85%. Thirty days: -17.14%.
I had to check those numbers twice before I believed them.
I looked at a few sources. Here's my synthesis.
The market isn't small, but liquidity is shallow.
It's still down -94.65% from its all-time high, and 85.16% of the supply is already circulating.
The remaining unlock schedule is like a reservoir that's run dry, with the bottom full of tokens waiting to be sold.
My position that day felt awkward: the 10-day range was 0.1693 to 0.2024, and the current price sat at the 47.13th percentile.
Right in the middle.
There's never a shortage of narratives around this token. What's missing is buying support.
The range is absurdly tight, funding is +0.0029%, neither longs nor shorts are dominating, and leverage is piled up on both sides.
At this level, I'll keep an eye on it, but I won't pay it more attention.
Honestly, the middle is the costliest place to be. It gives no one a clear reason to think they're wrong.
$BTC $ETH
#FET #比特币 #Cryptocurrency
I'm sure someone in the comments will say this sideways action is a buildup. What do you all think?
The above is a personal record of my trading system and observations of data, and does not constitute investment advice.