🚨 $ETH H Daily Update: Drops Below $2,000! Golden Dip or More Downside Ahead? 📉📊
Hello Square Family! Let’s break down the macro price action on the $ETH /USDT 1D chart.
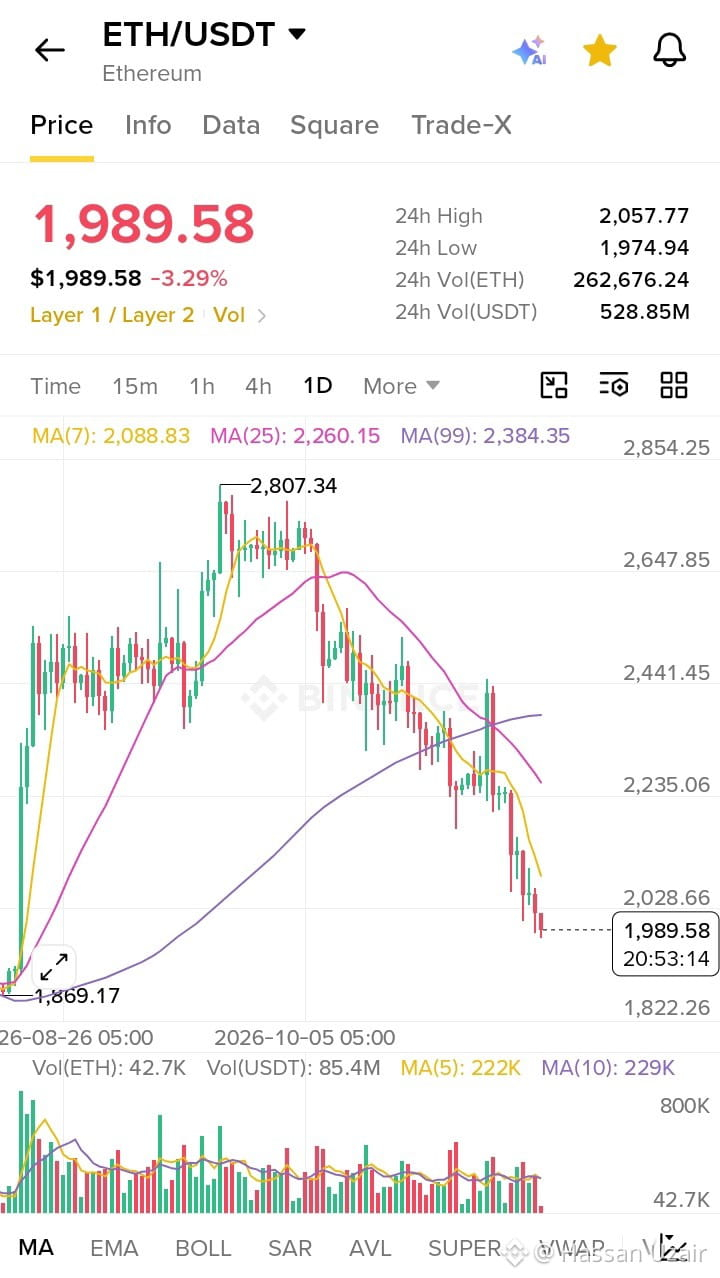
Following a prolonged downward trend from the $2,807.34 peak, Ethereum has broken below the key psychological $2,000 mark, currently trading around $1,989.58 (-3.29%).
📊 Technical Snapshot (Daily Timeframe):
Current Price: $1,989.58
MA(7): 2,088.83
MA(25): 2,260.15
MA(99): 2,384.35
24h High / Low: $2,057.77 / $1,974.94
The daily moving averages remain in a bearish alignment above the current price, indicating strong near-term selling pressure. Buyers now need to defend the $1,974 local low—or the deeper $1,869 historical support—to spark a relief bounce.
💬 Let’s discuss in the comments: Are you buying this sub-2KETH dip, or waiting for a confirmed trend reversal? Drop your targets below! 👇
#ETH #Ethereum #BinanceSquare #TechnicalAnalysis #CryptoTrading
Hello Square Family! Let’s break down the macro price action on the $ETH /USDT 1D chart.
Following a prolonged downward trend from the $2,807.34 peak, Ethereum has broken below the key psychological $2,000 mark, currently trading around $1,989.58 (-3.29%).
📊 Technical Snapshot (Daily Timeframe):
Current Price: $1,989.58
MA(7): 2,088.83
MA(25): 2,260.15
MA(99): 2,384.35
24h High / Low: $2,057.77 / $1,974.94
The daily moving averages remain in a bearish alignment above the current price, indicating strong near-term selling pressure. Buyers now need to defend the $1,974 local low—or the deeper $1,869 historical support—to spark a relief bounce.
💬 Let’s discuss in the comments: Are you buying this sub-2KETH dip, or waiting for a confirmed trend reversal? Drop your targets below! 👇
#ETH #Ethereum #BinanceSquare #TechnicalAnalysis #CryptoTrading