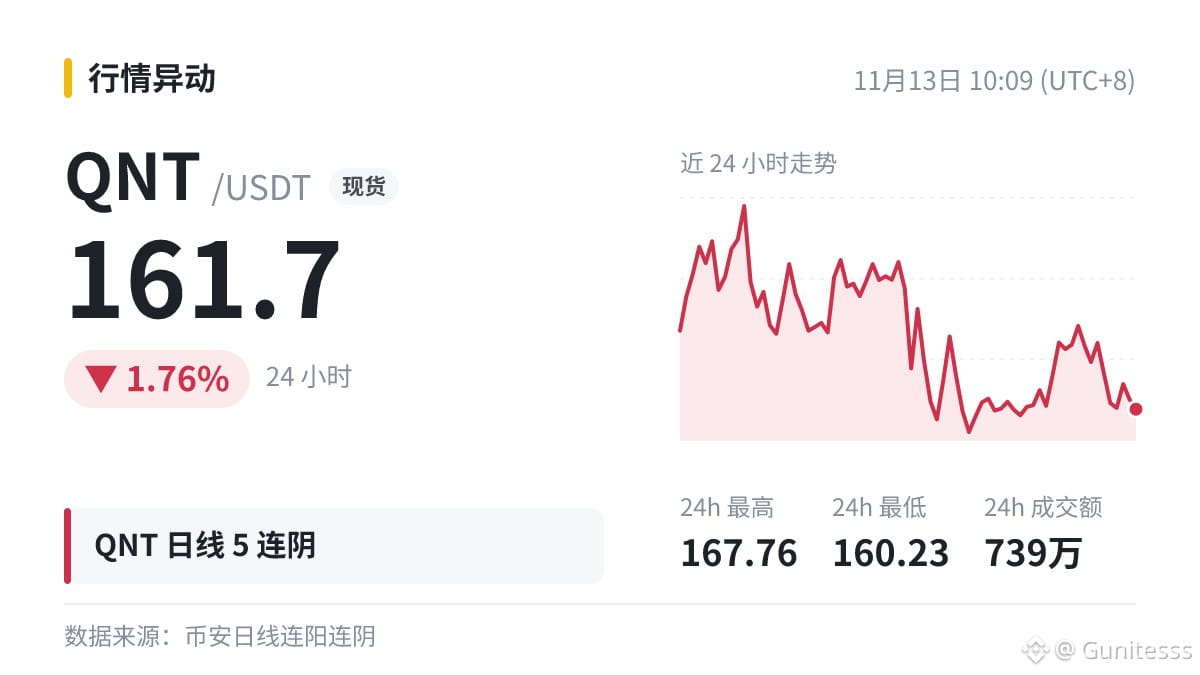
$QNT Five consecutive daily candlesticks have closed lower, for a cumulative decline of 16.48%; today’s decline so far is 1.25%.
How is this figure calculated?
Consecutive up or down days simply record the direction of several candlesticks in a row; they don’t reflect the size of each candle’s body. A few small bullish candles and a few large bullish candles have very different momentum.
There’s no fixed duration for a consecutive uptrend or downtrend. Sometimes it continues for a long time; other times it reverses after just a few days. The number of days alone can’t predict what happens next.
Don’t let a single number throw off your original strategy, and don’t use borrowed money to test a hunch.
How is this figure calculated?
Consecutive up or down days simply record the direction of several candlesticks in a row; they don’t reflect the size of each candle’s body. A few small bullish candles and a few large bullish candles have very different momentum.
There’s no fixed duration for a consecutive uptrend or downtrend. Sometimes it continues for a long time; other times it reverses after just a few days. The number of days alone can’t predict what happens next.
Don’t let a single number throw off your original strategy, and don’t use borrowed money to test a hunch.