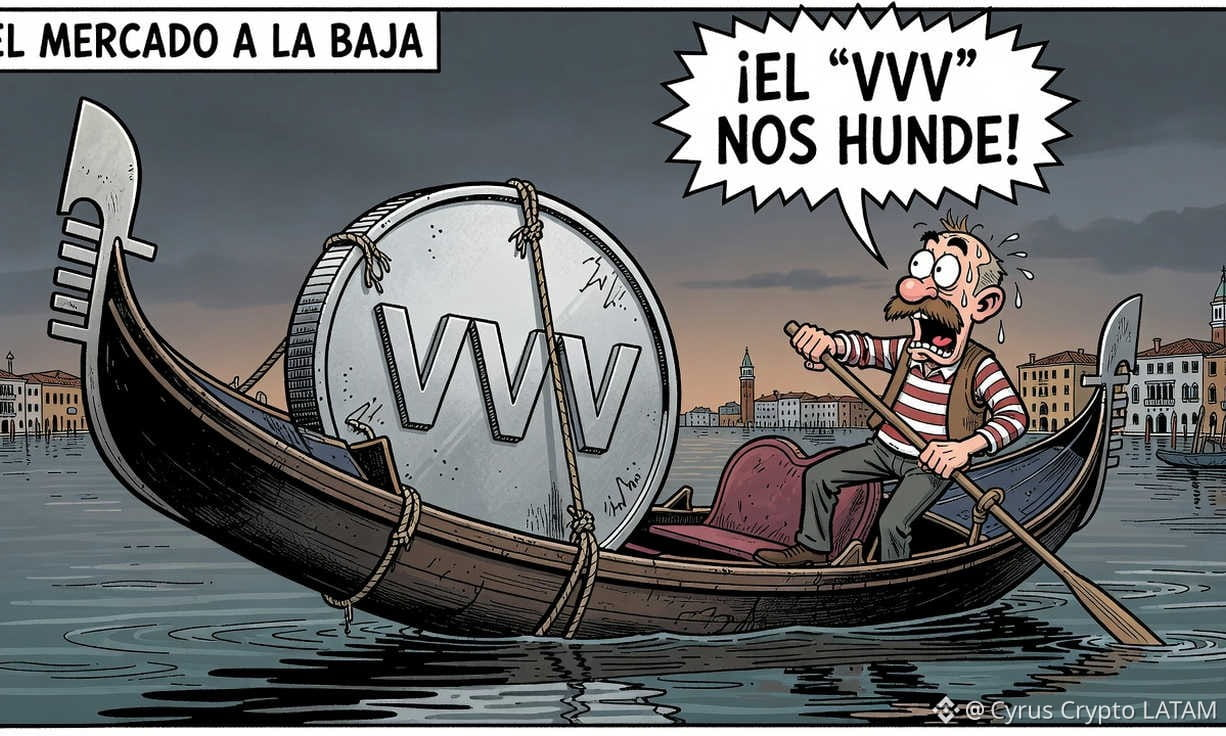
$VVV falls 4.1% compared with the previous close and puts support levels to the test on November 12
#VeniceToken trades at USD $18.96, with pressure on its short-term indicators, a 19.22% decline over 30 days, and daily volume below the monthly average. The price remains above the SMA-200, but the available data do not confirm a news catalyst, derivatives flows, or on-chain activity that would explain the pullback; in addition, the daily change figures contain a discrepancy that calls for caution.
Market data show a decline from the previous close, a price below the intraday VWAP of USD $19.29, and a sequence of negative returns over seven-, 14-, and 30-day periods. VWAP is the session’s volume-weighted average price and is often used to assess whether buyers or sellers are in control of intraday trading.
The reported market capitalization is approximately USD $933.54 million, but no circulating supply, total supply, issuance schedule, or comparable valuations are provided.
Recommendation: HOLD existing positions; for new entries, wait for confirmation. The methodology considers five signals: trend relative to moving averages, RSI, MACD, volume, and long-term support. Three point to caution—the price is below short-term moving averages, MACD is bearish, and volume is below its monthly average—one is neutral to weak, with an RSI of 36.4, and one mitigates risk: the price remains above the SMA-200 at USD $17.48.
For the short term, a conditional strategy is to watch the USD $18.59 area and not buy until the price stabilizes and recovers USD $19.29. If the price confirms that advance, USD $19.97 and the USD $20.35–$20.38 range are reference points for taking profits, not guaranteed targets. A close below today’s low would be a signal to limit or reconsider exposure, without inventing a more precise stop level than the available data support.
#VeniceToken trades at USD $18.96, with pressure on its short-term indicators, a 19.22% decline over 30 days, and daily volume below the monthly average. The price remains above the SMA-200, but the available data do not confirm a news catalyst, derivatives flows, or on-chain activity that would explain the pullback; in addition, the daily change figures contain a discrepancy that calls for caution.
Market data show a decline from the previous close, a price below the intraday VWAP of USD $19.29, and a sequence of negative returns over seven-, 14-, and 30-day periods. VWAP is the session’s volume-weighted average price and is often used to assess whether buyers or sellers are in control of intraday trading.
The reported market capitalization is approximately USD $933.54 million, but no circulating supply, total supply, issuance schedule, or comparable valuations are provided.
Recommendation: HOLD existing positions; for new entries, wait for confirmation. The methodology considers five signals: trend relative to moving averages, RSI, MACD, volume, and long-term support. Three point to caution—the price is below short-term moving averages, MACD is bearish, and volume is below its monthly average—one is neutral to weak, with an RSI of 36.4, and one mitigates risk: the price remains above the SMA-200 at USD $17.48.
For the short term, a conditional strategy is to watch the USD $18.59 area and not buy until the price stabilizes and recovers USD $19.29. If the price confirms that advance, USD $19.97 and the USD $20.35–$20.38 range are reference points for taking profits, not guaranteed targets. A close below today’s low would be a signal to limit or reconsider exposure, without inventing a more precise stop level than the available data support.