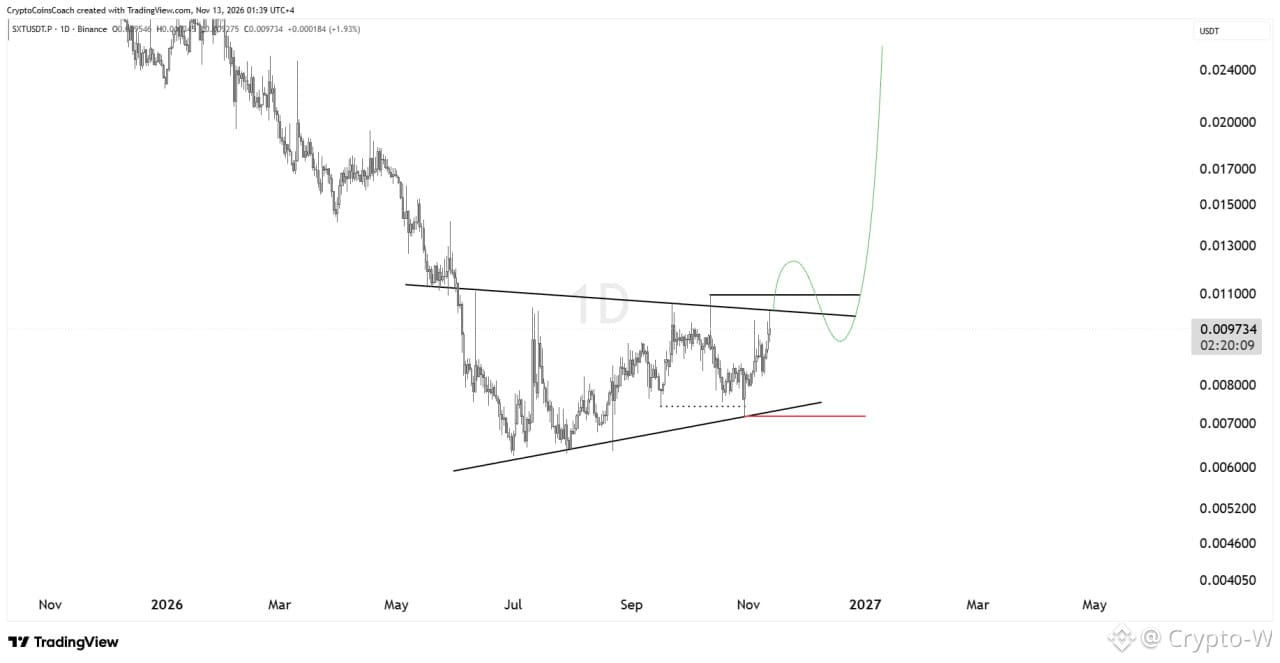
$SXT appears to be forming a bullish reversal pattern after a prolonged downtrend.
SXT is currently trading around $0.00972, approaching a significant descending resistance trendline. At the same time, the price has been forming higher lows, suggesting that buyers are gradually gaining strength.
If SXT manages to break above and hold within the $0.0100 to $0.0110 range, this could confirm a bullish breakout and open the door to a stronger recovery.
The first upside zone I’m watching is between $0.0120 and $0.0130. If momentum continues, SXT could extend toward $0.0170–$0.0200, with $0.0250 or higher a possibility over the longer term.
However, rejection at descending resistance could push the price back toward the $0.0085–$0.0080 range. Losing the main support, around $0.0072, would significantly weaken this bullish scenario.
Key levels:
Current price: $0.00972
Breakout zone: $0.0100–$0.0110
Immediate support: $0.0080–$0.0085
Main support: $0.0072
First target: $0.0120–$0.0130
Higher targets: $0.0170–$0.0200
Extended target: $0.0250+
Invalidation: Below $0.0072
For now, I’m waiting for a confirmed breakout on the daily chart above $0.0110 before anticipating a more significant bullish move.
The structure looks promising, but the broader downtrend has not yet reversed. A breakout followed by a successful retest would provide much stronger confirmation than simply anticipating the move.
SXT is currently trading around $0.00972, approaching a significant descending resistance trendline. At the same time, the price has been forming higher lows, suggesting that buyers are gradually gaining strength.
If SXT manages to break above and hold within the $0.0100 to $0.0110 range, this could confirm a bullish breakout and open the door to a stronger recovery.
The first upside zone I’m watching is between $0.0120 and $0.0130. If momentum continues, SXT could extend toward $0.0170–$0.0200, with $0.0250 or higher a possibility over the longer term.
However, rejection at descending resistance could push the price back toward the $0.0085–$0.0080 range. Losing the main support, around $0.0072, would significantly weaken this bullish scenario.
Key levels:
Current price: $0.00972
Breakout zone: $0.0100–$0.0110
Immediate support: $0.0080–$0.0085
Main support: $0.0072
First target: $0.0120–$0.0130
Higher targets: $0.0170–$0.0200
Extended target: $0.0250+
Invalidation: Below $0.0072
For now, I’m waiting for a confirmed breakout on the daily chart above $0.0110 before anticipating a more significant bullish move.
The structure looks promising, but the broader downtrend has not yet reversed. A breakout followed by a successful retest would provide much stronger confirmation than simply anticipating the move.