
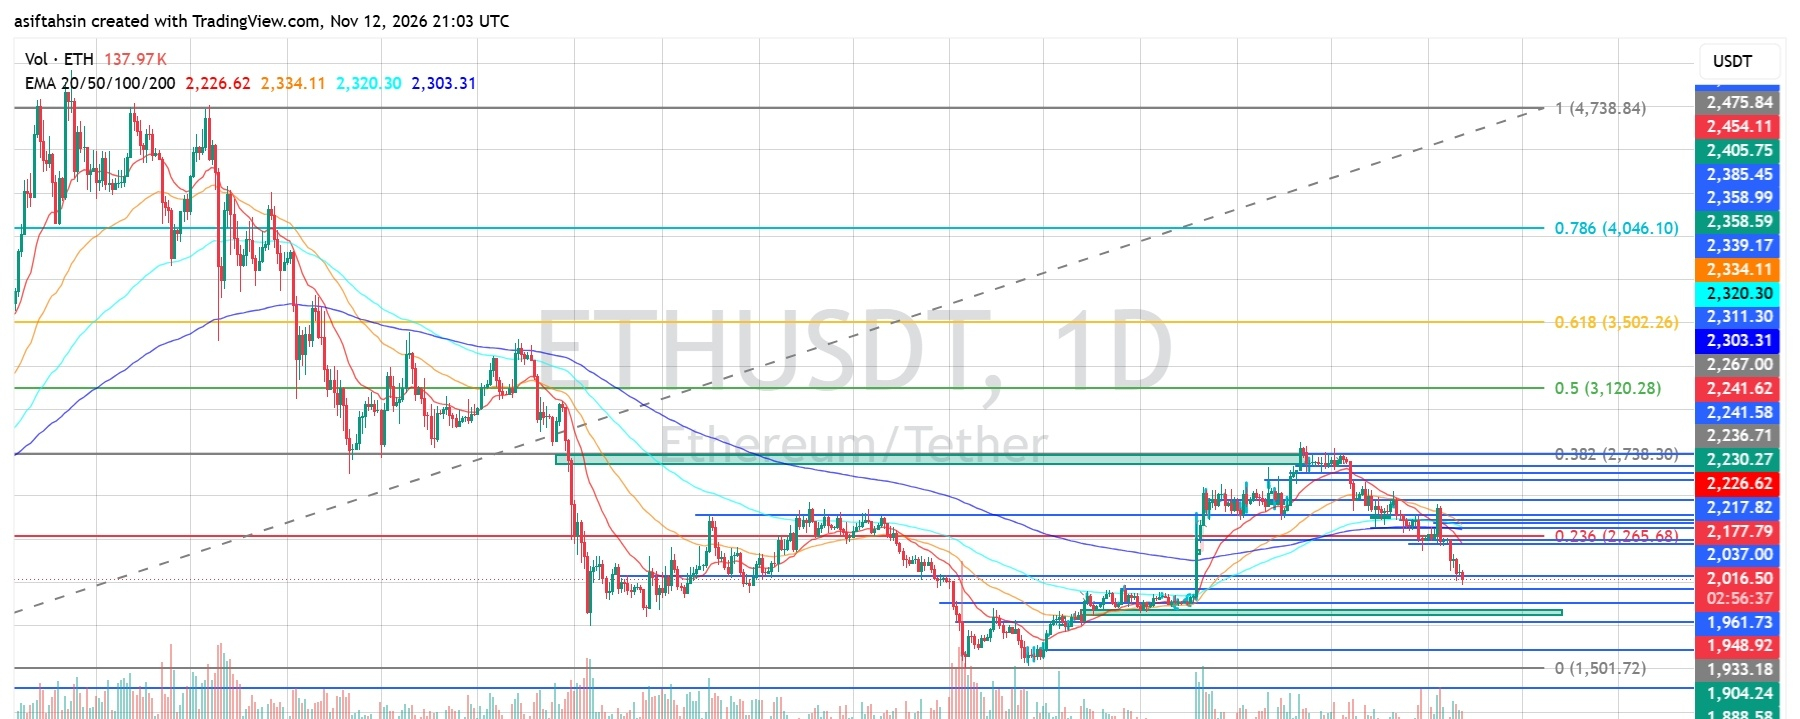

Ethereum is trading around $2,016–$2,018 on the daily chart after losing several important support levels. The recent decline has pushed ETH below all four major EMAs, while price is now approaching a critical support region around $2,000–$1,960.
The short-term structure remains bearish, and buyers need to reclaim the $2,177–$2,265 resistance zone to show meaningful recovery strength.
EMA Structure
ETH is trading below all four major moving averages, confirming that sellers currently control the daily trend.
- 20 EMA: $2,226.79
- 50 EMA: $2,334.18
- 100 EMA: $2,320.34
- 200 EMA: $2,303.32
The 20 EMA is below the other major averages, while all four remain above the current price. This creates a strong resistance cluster between $2,226 and $2,334.
A sustained move above this region would be an early sign of improving market structure.
Fibonacci Levels & Resistance Zones
Based on the chart's Fibonacci retracement:
- 0.236: $2,265.68
- 0.382: $2,738.30
- 0.5: $3,120.28
- 0.618: $3,502.26
- 0.786: $4,046.10
The $2,265 level is the first major Fibonacci resistance. ETH needs to reclaim this level before a stronger recovery toward the higher retracement zones becomes realistic.
RSI Momentum
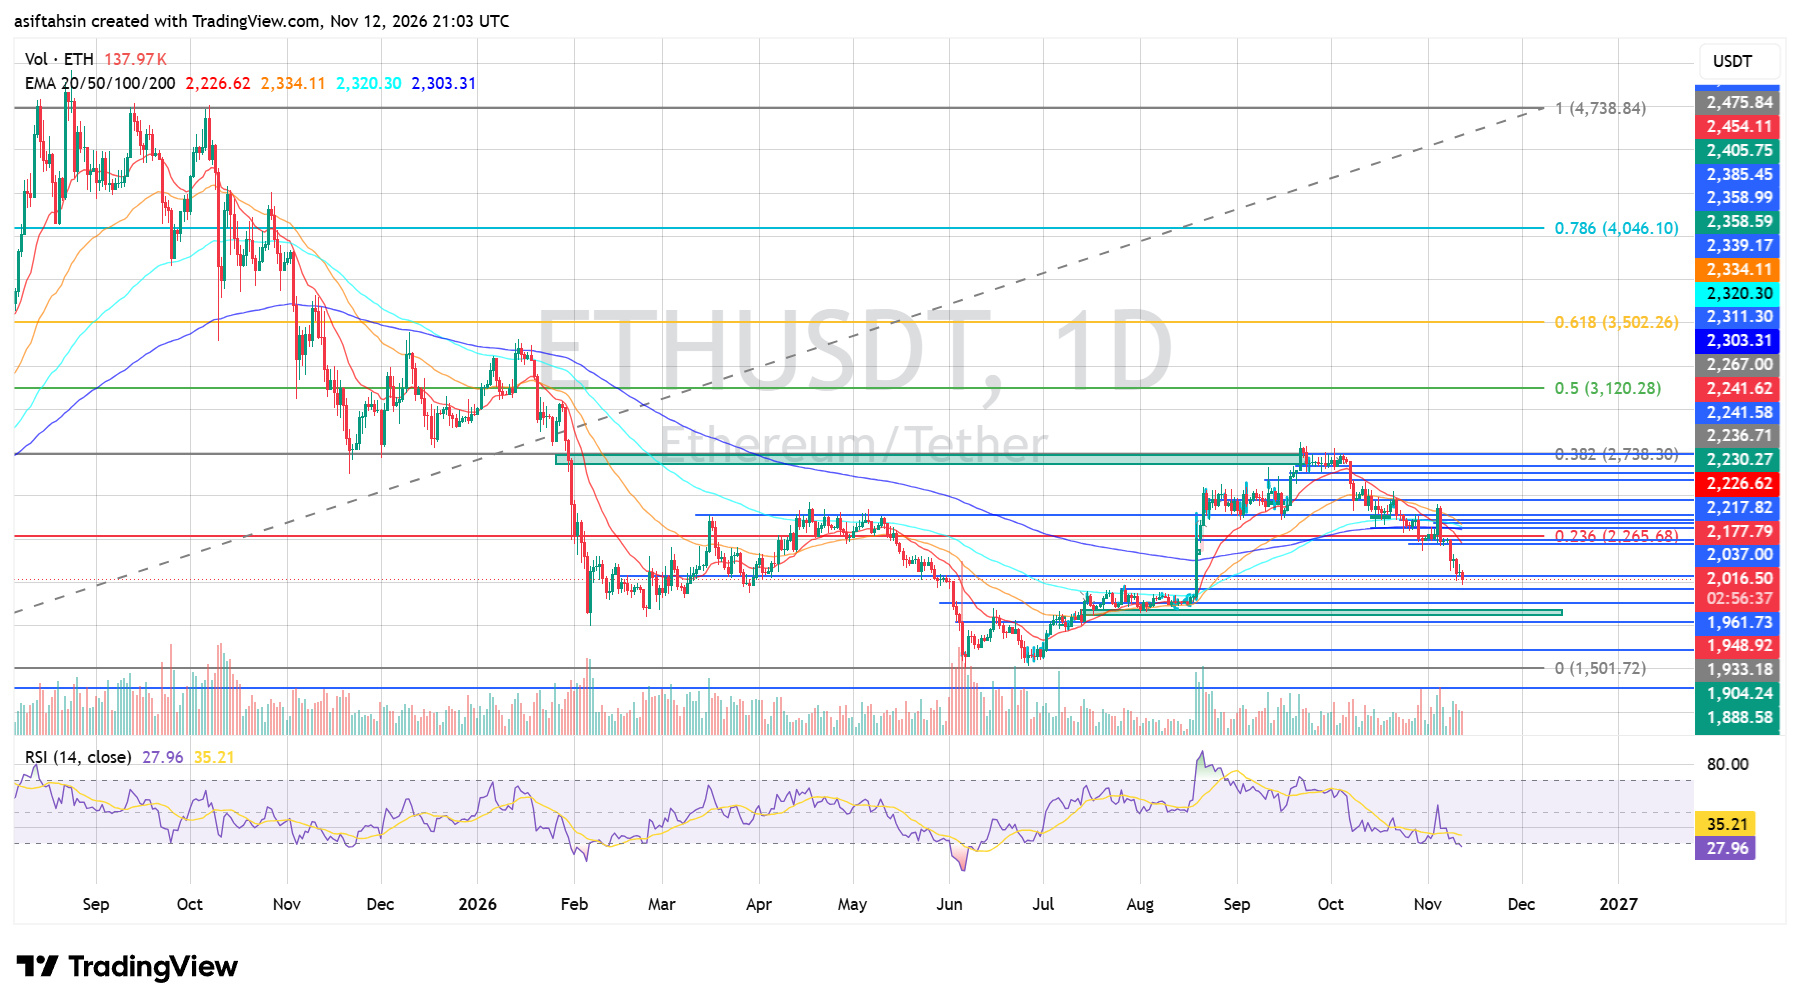
The daily RSI is around 27.96, while its signal average is near 35.21.
This places RSI in oversold territory, indicating that selling pressure has become extended. A short-term relief bounce is possible, but oversold conditions alone do not confirm a trend reversal.
A move back above 35–40 would provide an early indication that bearish momentum is weakening.
Market Structure & Support
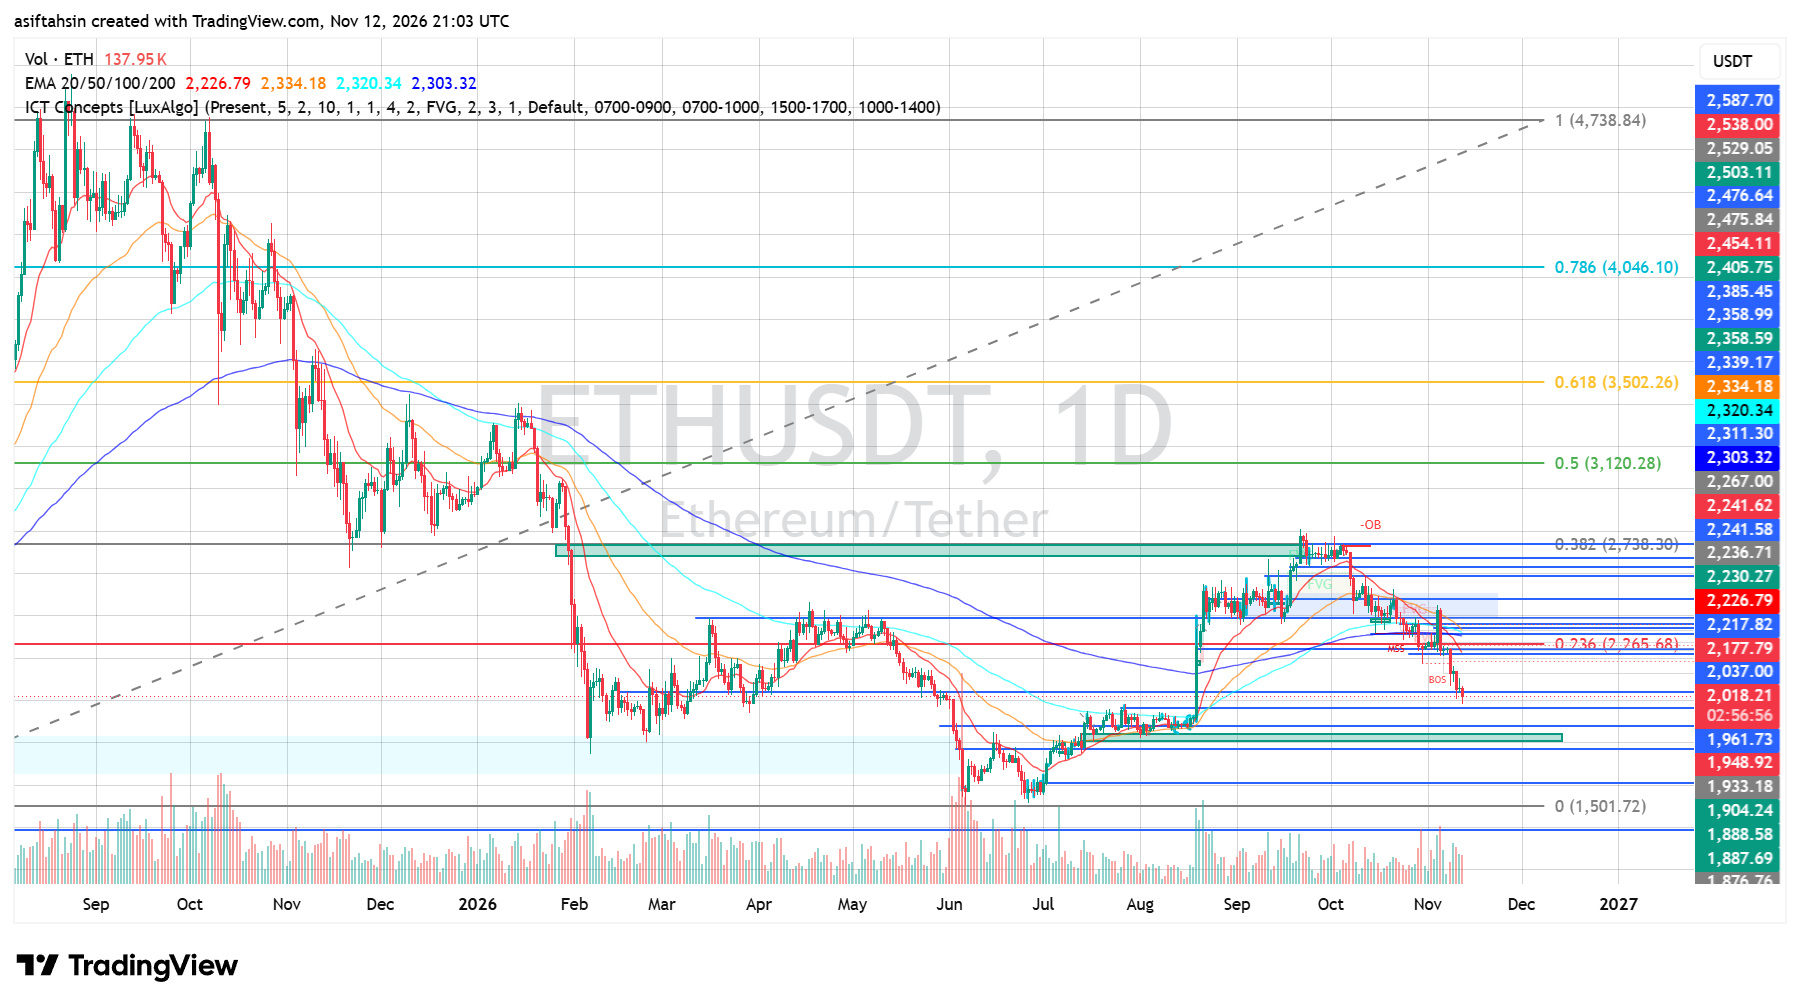
ETH has experienced a sharp decline from its recent recovery high near the $2,400 area. The latest breakdown below the $2,177–$2,241 region has weakened the short-term structure.
The immediate focus is now on whether buyers can defend the $2,000 psychological level and the support zone below it.
Bullish Recovery Scenario
If ETH holds the $2,000 region and buyers regain momentum, the first recovery targets are:
- $2,037
- $2,177–$2,241
- $2,265–$2,267
- $2,303–$2,334 EMA resistance zone
- $2,385–$2,405
A sustained daily close above $2,334 would improve the recovery outlook. Reclaiming $2,405 would strengthen the bullish case further.
Bearish Continuation Scenario
If ETH fails to hold the current support region and daily candles continue closing lower, further downside could follow.
Important support levels to monitor:
- $2,000 psychological support
- $1,961–$1,948
- $1,933
- $1,904–$1,888
- $1,876
A decisive breakdown below $1,888 would increase the risk of a deeper move toward the major Fibonacci baseline at $1,501.72.
Key Levels
Resistance:
- $2,037
- $2,177–$2,241
- $2,265–$2,267
- $2,303–$2,334
- $2,385–$2,405
- $2,538
Support:
- $2,000
- $1,961–$1,948
- $1,933
- $1,904–$1,888
- $1,876
- $1,501
Final Outlook
ETH remains bearish on the daily timeframe while trading below the four major EMAs. RSI is oversold, so a relief bounce is possible, but buyers still need to reclaim $2,265 and then the $2,303–$2,334 EMA cluster to establish a stronger recovery.
For now, $2,000 is the immediate level to watch. Losing the $1,948–$1,933 support zone could expose ETH to further downside toward $1,904 and $1,888.
Overall Bias: Bearish below $2,265 | Recovery confirmation above $2,334 | Further downside risk below $1,948.
