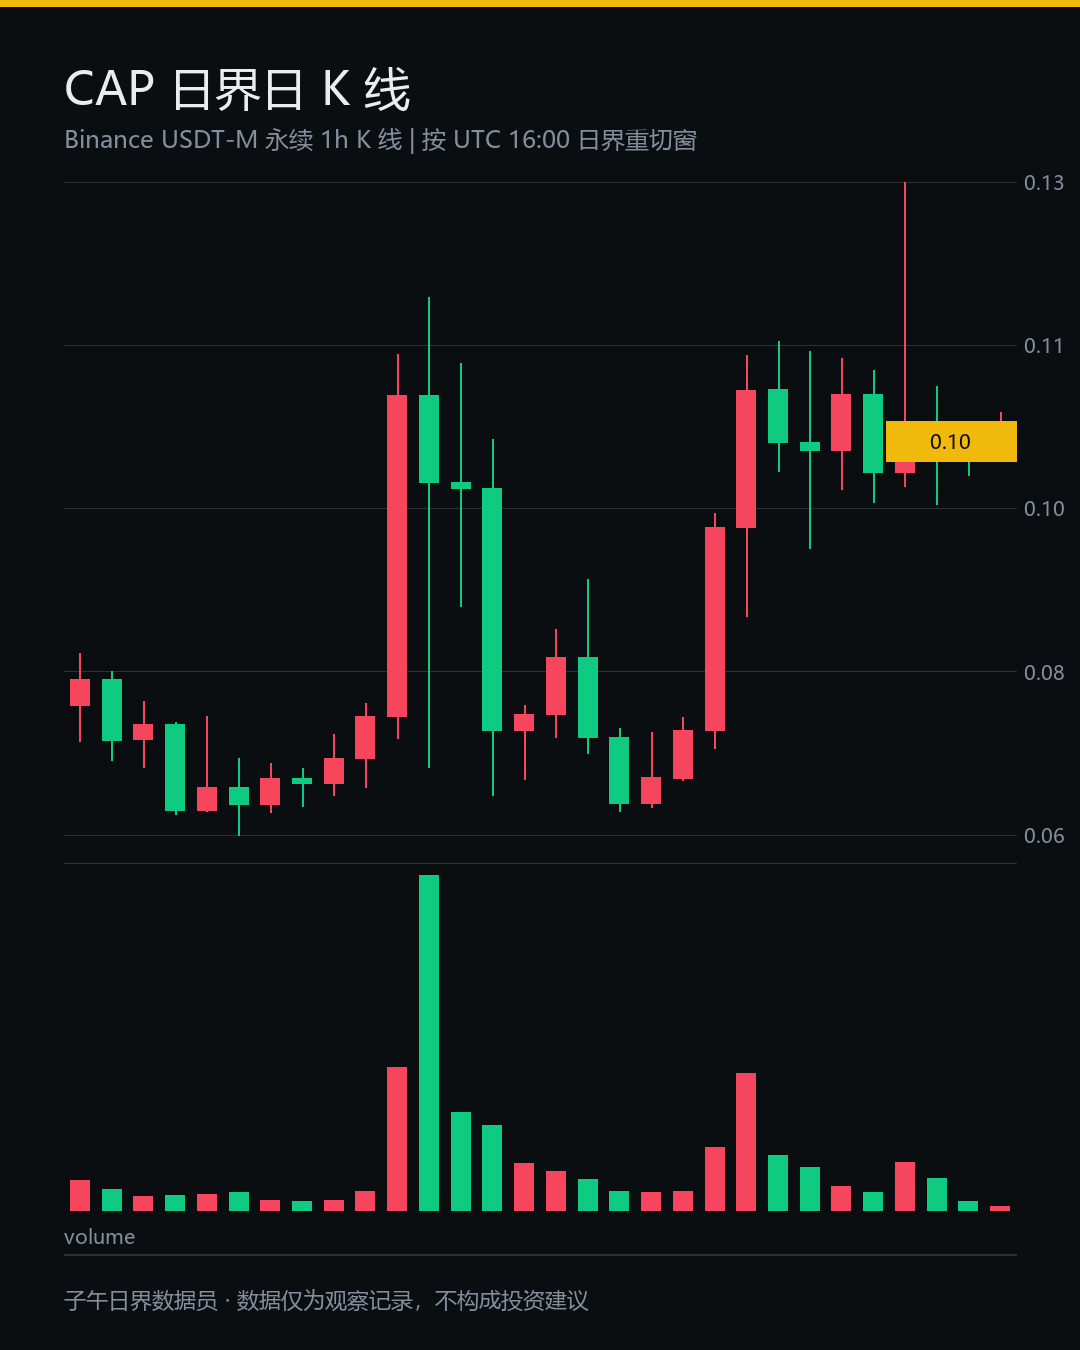
That red candle on $CAP —I only looked back and reckoned up the damage half a month later.
That night, around midnight, a batch of small-cap contracts all started sliding.
Honestly, I initially thought something had happened to just one coin.
First, the volume.
On the 26th, trading volume was 250.3 million. The next day it fell to 80 million, and the day after that it was down to just 70.21 million.
The money leaves first; the price follows.
It dropped 22.44% in 24 hours, with the price now at just 0.07362—at the 17.97th percentile of its 10-day range.
Volume expanded in the first half and contracted in the second. The tokens changed hands along the way.
Of the last 25 hourly candles, only 9 closed green.
That says more than the drop itself.
The funding rate flipped to -0.0075%—shorts are paying longs.
I’ve always remembered how the leverage balance tipped toward the short side.
That same day, another small-cap coin from the batch fell 22.215%, with bids so thin they were like paper.
With a market like this, tokens the size of $BTC and $ETH aren’t even at the table.
When the tide goes out, the shallowest spots downstream are always the first to dry up.
Liquidity is like a reservoir gate: when it closes, the shallowest banks go dry first.
The ones further down the line don’t even have a place to crouch.
My approach is to keep watching and not guess where the bottom is.
How many times have you seen a whole row bleed out like this? Share in the comments.
#CAP #SKDD #Cryptocurrency
These are records from my personal trading system and observations of market data. They do not constitute investment advice.
That night, around midnight, a batch of small-cap contracts all started sliding.
Honestly, I initially thought something had happened to just one coin.
First, the volume.
On the 26th, trading volume was 250.3 million. The next day it fell to 80 million, and the day after that it was down to just 70.21 million.
The money leaves first; the price follows.
It dropped 22.44% in 24 hours, with the price now at just 0.07362—at the 17.97th percentile of its 10-day range.
Volume expanded in the first half and contracted in the second. The tokens changed hands along the way.
Of the last 25 hourly candles, only 9 closed green.
That says more than the drop itself.
The funding rate flipped to -0.0075%—shorts are paying longs.
I’ve always remembered how the leverage balance tipped toward the short side.
That same day, another small-cap coin from the batch fell 22.215%, with bids so thin they were like paper.
With a market like this, tokens the size of $BTC and $ETH aren’t even at the table.
When the tide goes out, the shallowest spots downstream are always the first to dry up.
Liquidity is like a reservoir gate: when it closes, the shallowest banks go dry first.
The ones further down the line don’t even have a place to crouch.
My approach is to keep watching and not guess where the bottom is.
How many times have you seen a whole row bleed out like this? Share in the comments.
#CAP #SKDD #Cryptocurrency
These are records from my personal trading system and observations of market data. They do not constitute investment advice.