🚀 Attention, traders! Live update: $HYPE /USDT breaking new ground 📊🔥
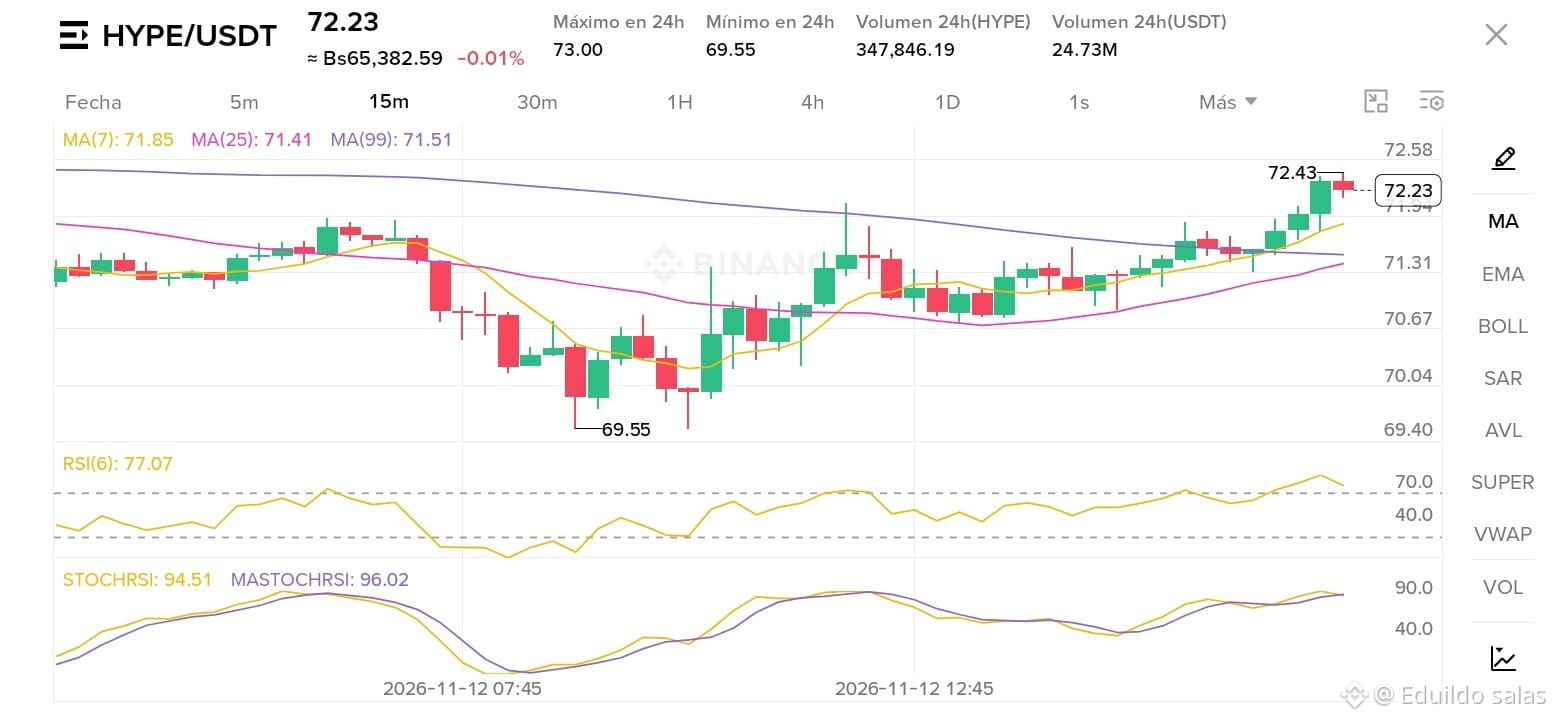
Taking a look at the HYPE/USDT chart on the 15m timeframe, price action is showing a very interesting bullish move after bottoming out at 69.55 USDT.
Current price: 72.33 USDT
24h range: High of 73.00 USDT / Low of 69.55 USDT
24h volume: 24.73M USDT
📈 Quick Technical Analysis:
Moving Averages (MA): Bullish crossover confirmed. The MA(7) at 71.85 remains above the MA(25) (71.41) and MA(99) (71.51), pushing the price toward the upper end of the channel.
RSI(6): At 77.07, reflecting strong short-term buying pressure.
StochRSI / MastochRSI: In deeply overbought territory (94.51 and 96.02), prompting us to manage risk wisely, watch for possible pullbacks, or look for confirmation of trend continuation.
What do you think of this move? Are you expecting a retest, or are we going straight for a break above the 24-hour high? Share your thoughts in the comments! 👇💬
#HYPE #BinanceSquare #HuangExitNvidiaStrategyInFocus
Taking a look at the HYPE/USDT chart on the 15m timeframe, price action is showing a very interesting bullish move after bottoming out at 69.55 USDT.
Current price: 72.33 USDT
24h range: High of 73.00 USDT / Low of 69.55 USDT
24h volume: 24.73M USDT
📈 Quick Technical Analysis:
Moving Averages (MA): Bullish crossover confirmed. The MA(7) at 71.85 remains above the MA(25) (71.41) and MA(99) (71.51), pushing the price toward the upper end of the channel.
RSI(6): At 77.07, reflecting strong short-term buying pressure.
StochRSI / MastochRSI: In deeply overbought territory (94.51 and 96.02), prompting us to manage risk wisely, watch for possible pullbacks, or look for confirmation of trend continuation.
What do you think of this move? Are you expecting a retest, or are we going straight for a break above the 24-hour high? Share your thoughts in the comments! 👇💬
#HYPE #BinanceSquare #HuangExitNvidiaStrategyInFocus