$0G OG/USDT: Watch the action! 📈
Hello, Binance Square traders! Let’s take a look at how the OG/USDT pair has been behaving on the recent charts.
🔍 What the indicators show:
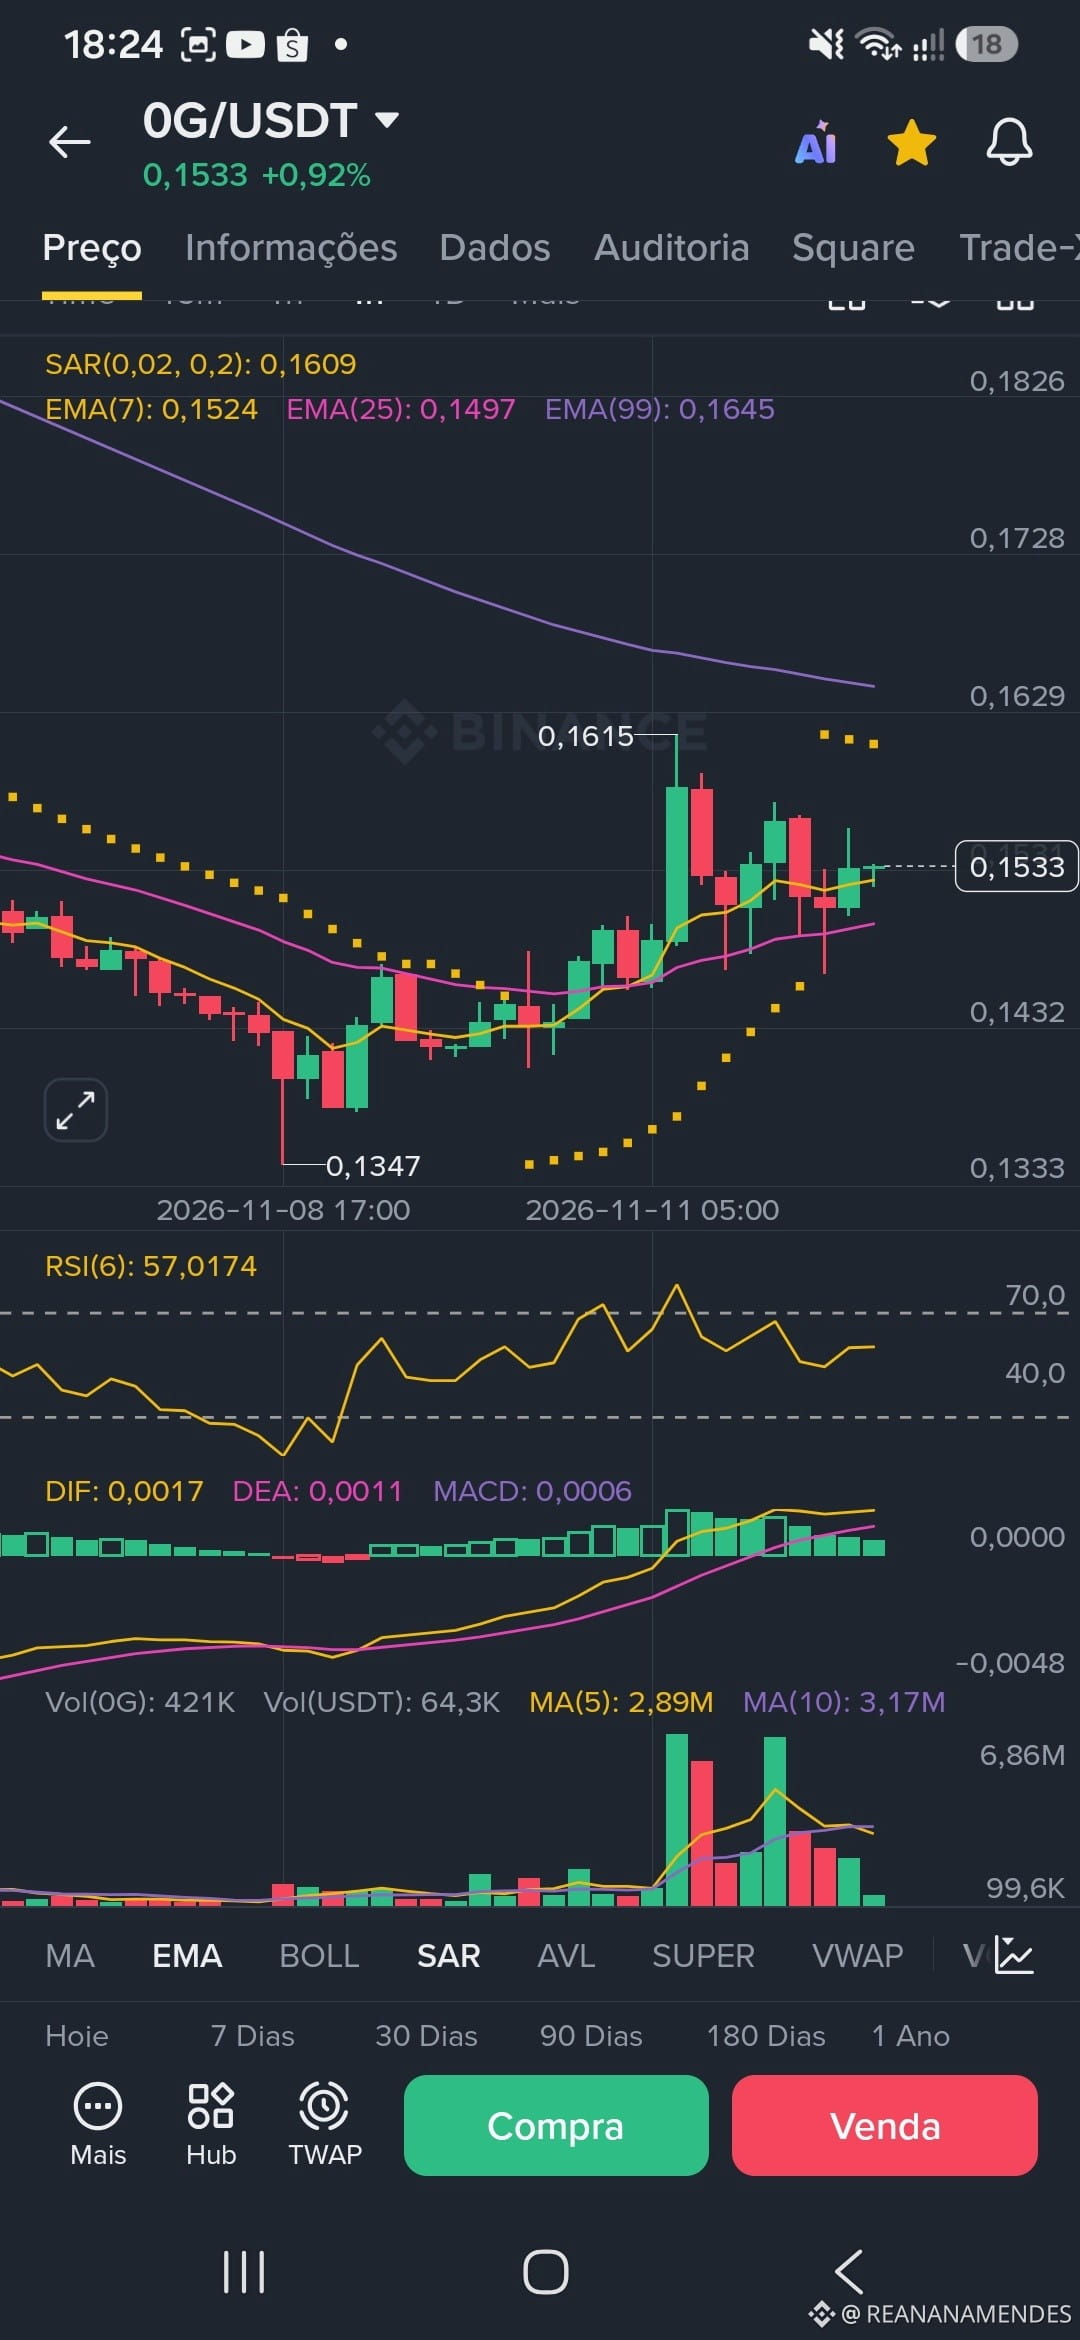
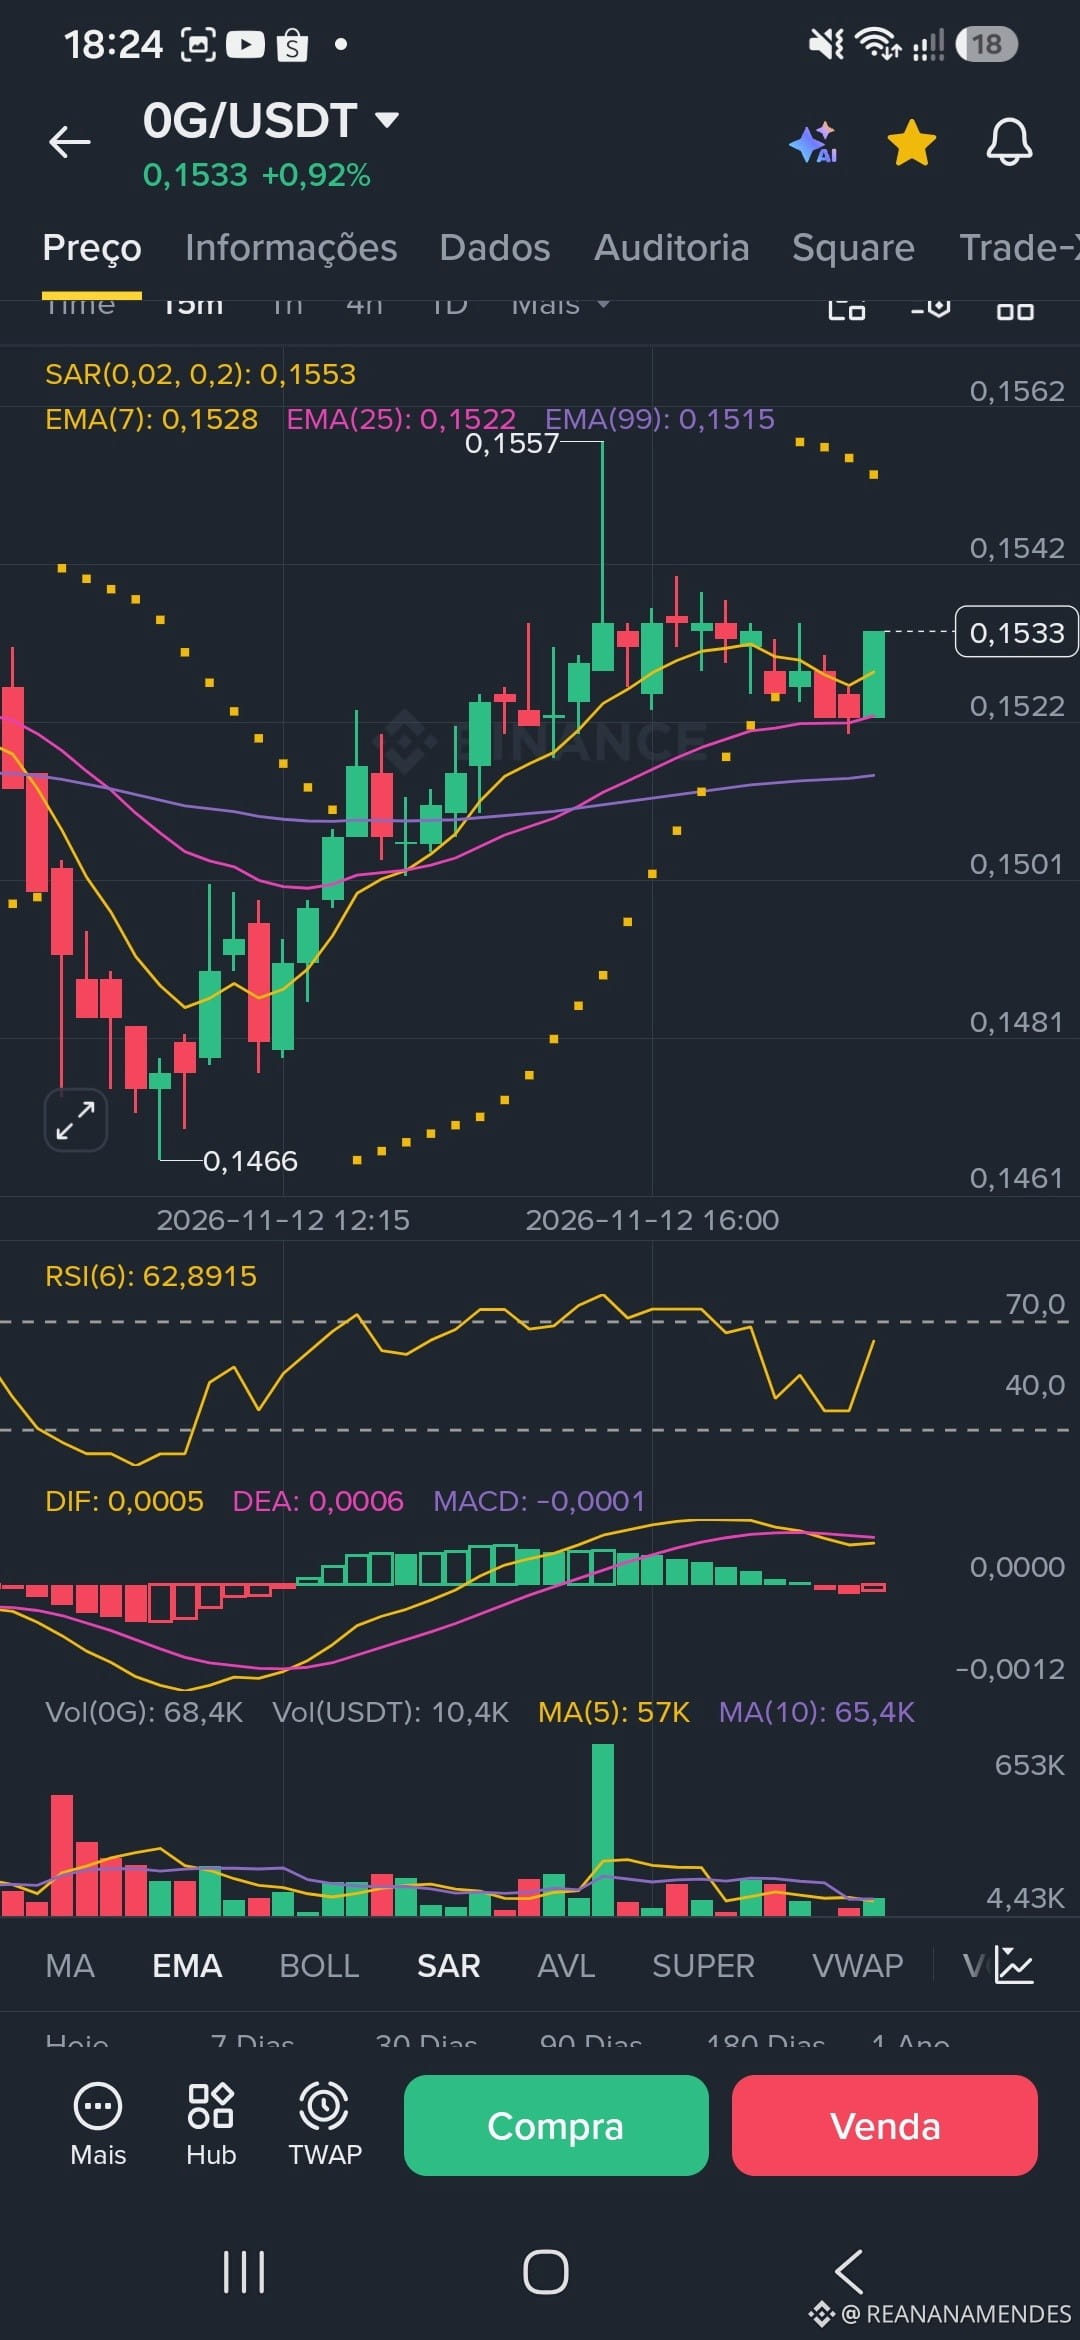
Trend and Moving Averages (EMAs): We can see the price seeking consolidation and testing important support and moving resistance areas. The EMAs show an interesting tug-of-war between buyers and sellers following the latest upward moves.
Parabolic SAR: The dotted points indicate short-term reversal dynamics, showing moments of acceleration and areas to watch for new targets.
RSI (6): Moving in intermediate zones (fluctuating around 57 to 62), indicating that the asset still has room to move without being extremely overbought at the moment, though caution is advised.
MACD & Volume: The MACD continues to track momentum in the flow, while volume spikes show where strong buying interest emerged during tests of the lows.
💡 Market Outlook: This is a time for closely monitoring breakouts and managing risk rigorously (with clearly defined Take-Profit and Stop-Loss targets), especially for short-term traders.
So, what’s your take on OG/USDT over the next few hours
Hello, Binance Square traders! Let’s take a look at how the OG/USDT pair has been behaving on the recent charts.
🔍 What the indicators show:
Trend and Moving Averages (EMAs): We can see the price seeking consolidation and testing important support and moving resistance areas. The EMAs show an interesting tug-of-war between buyers and sellers following the latest upward moves.
Parabolic SAR: The dotted points indicate short-term reversal dynamics, showing moments of acceleration and areas to watch for new targets.
RSI (6): Moving in intermediate zones (fluctuating around 57 to 62), indicating that the asset still has room to move without being extremely overbought at the moment, though caution is advised.
MACD & Volume: The MACD continues to track momentum in the flow, while volume spikes show where strong buying interest emerged during tests of the lows.
💡 Market Outlook: This is a time for closely monitoring breakouts and managing risk rigorously (with clearly defined Take-Profit and Stop-Loss targets), especially for short-term traders.
So, what’s your take on OG/USDT over the next few hours