$BTC
$BNB
$ETH
@
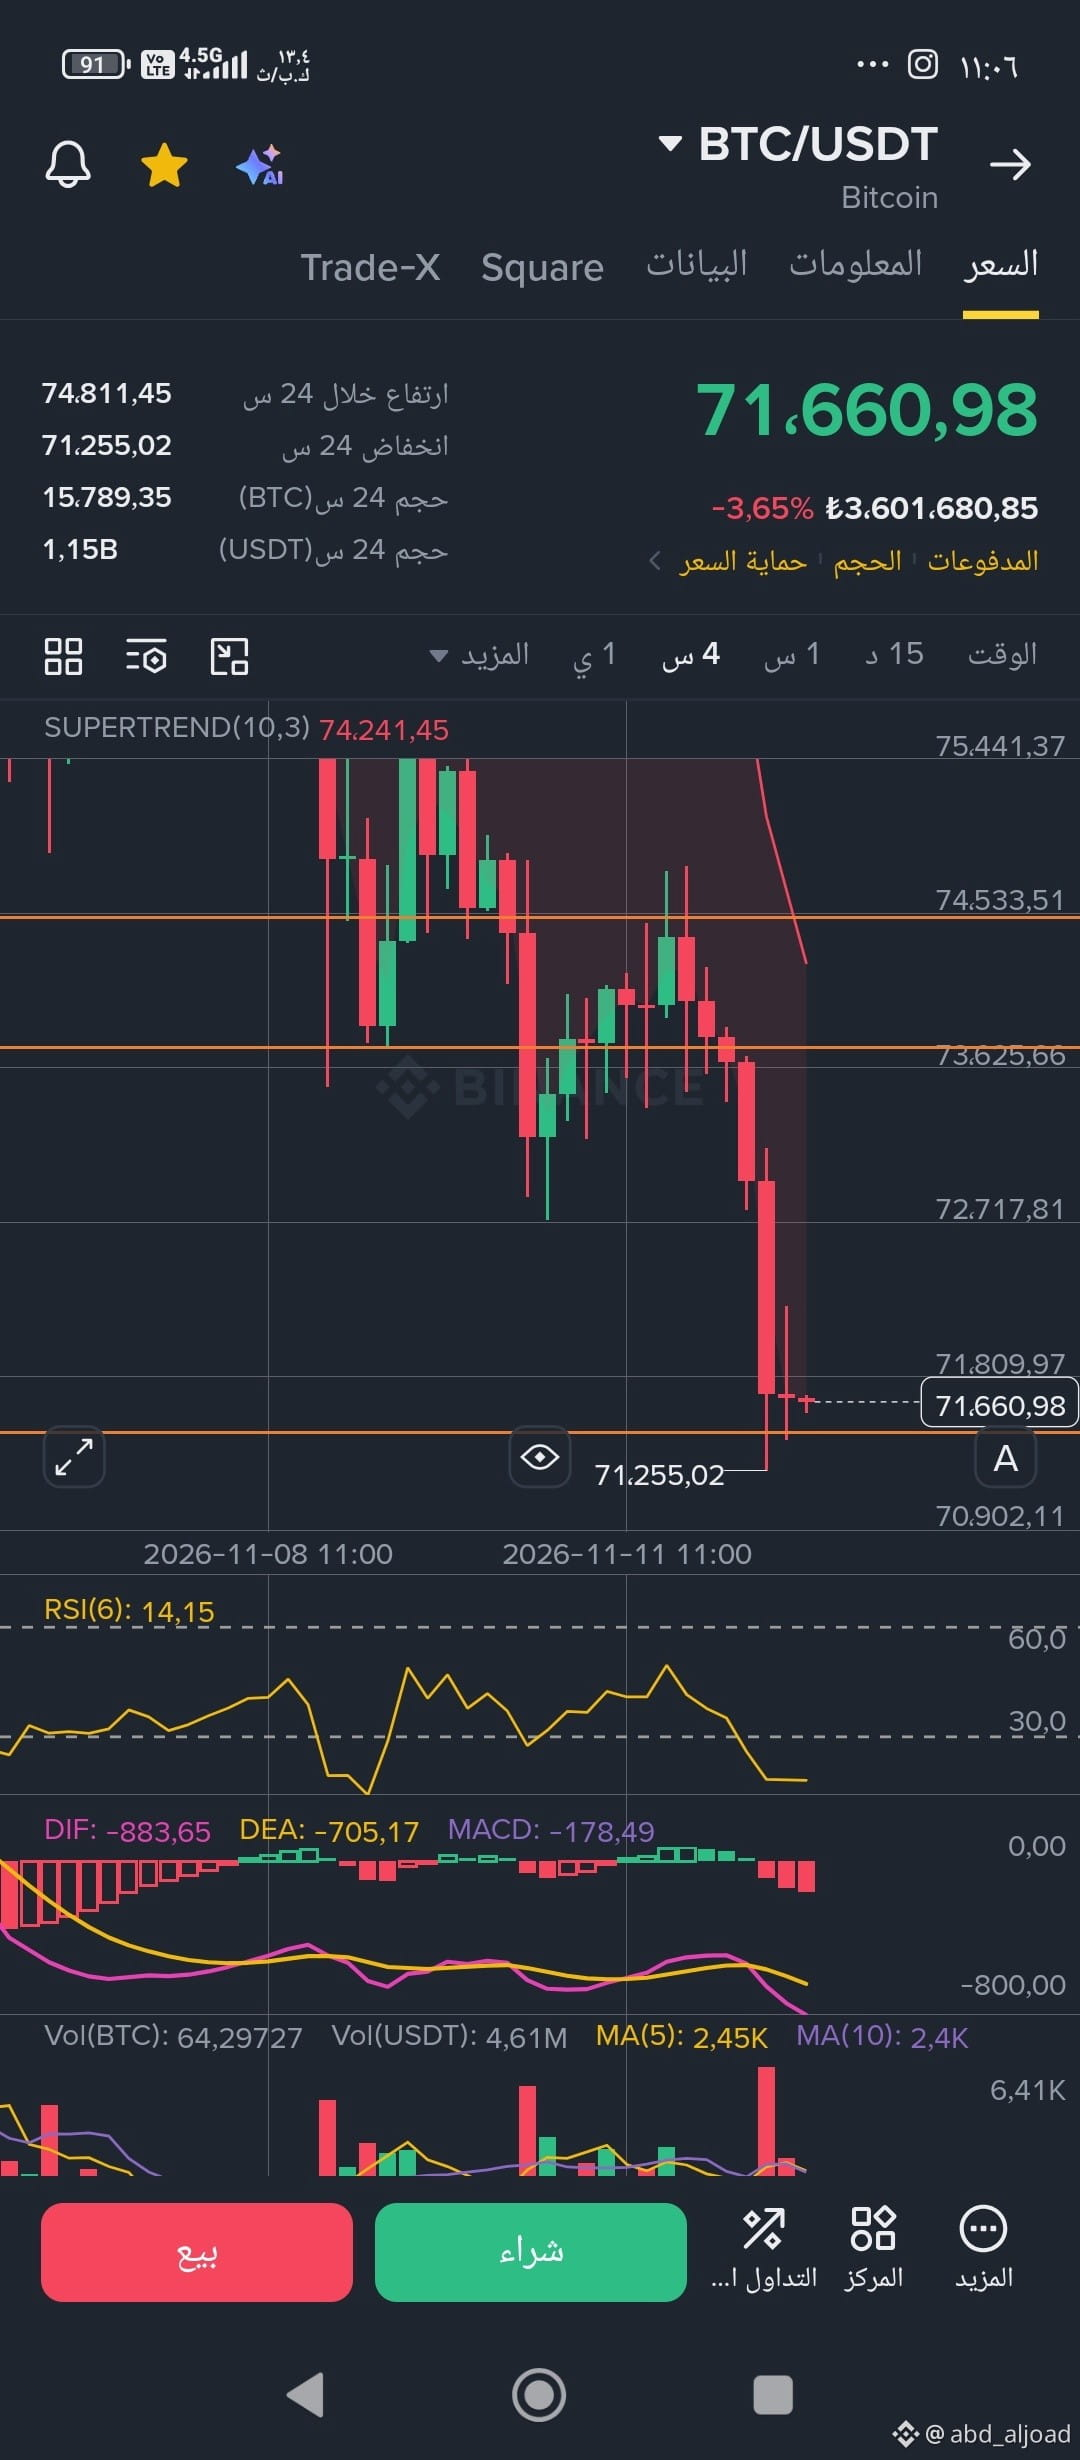
When we say our range is $825 and squeeze it into a narrow band between 74,500 and 73,674, believe me, you’re looking at numbers whose significance may be difficult to grasp at first glance.
When we talk about early signs of recovery, we’re not saying that 74,500 is an absolute recovery zone. Rather, we’re showing you how recovery is tested, and where it might succeed or fail.
Right now, I’m less concerned with the major recovery levels than with the trader who trusted me and followed my analysis. I want to show them where to watch, what to look for, and when they’ll know whether the setup is working or the breakdown is continuing.
I don’t want to drag this out any longer. Open the chart, draw two lines at the decision points we identified, and let the chart show you the significance of this range. God willing, your perspective on it will change.
If you can’t draw the two lines at the key levels and decision points,
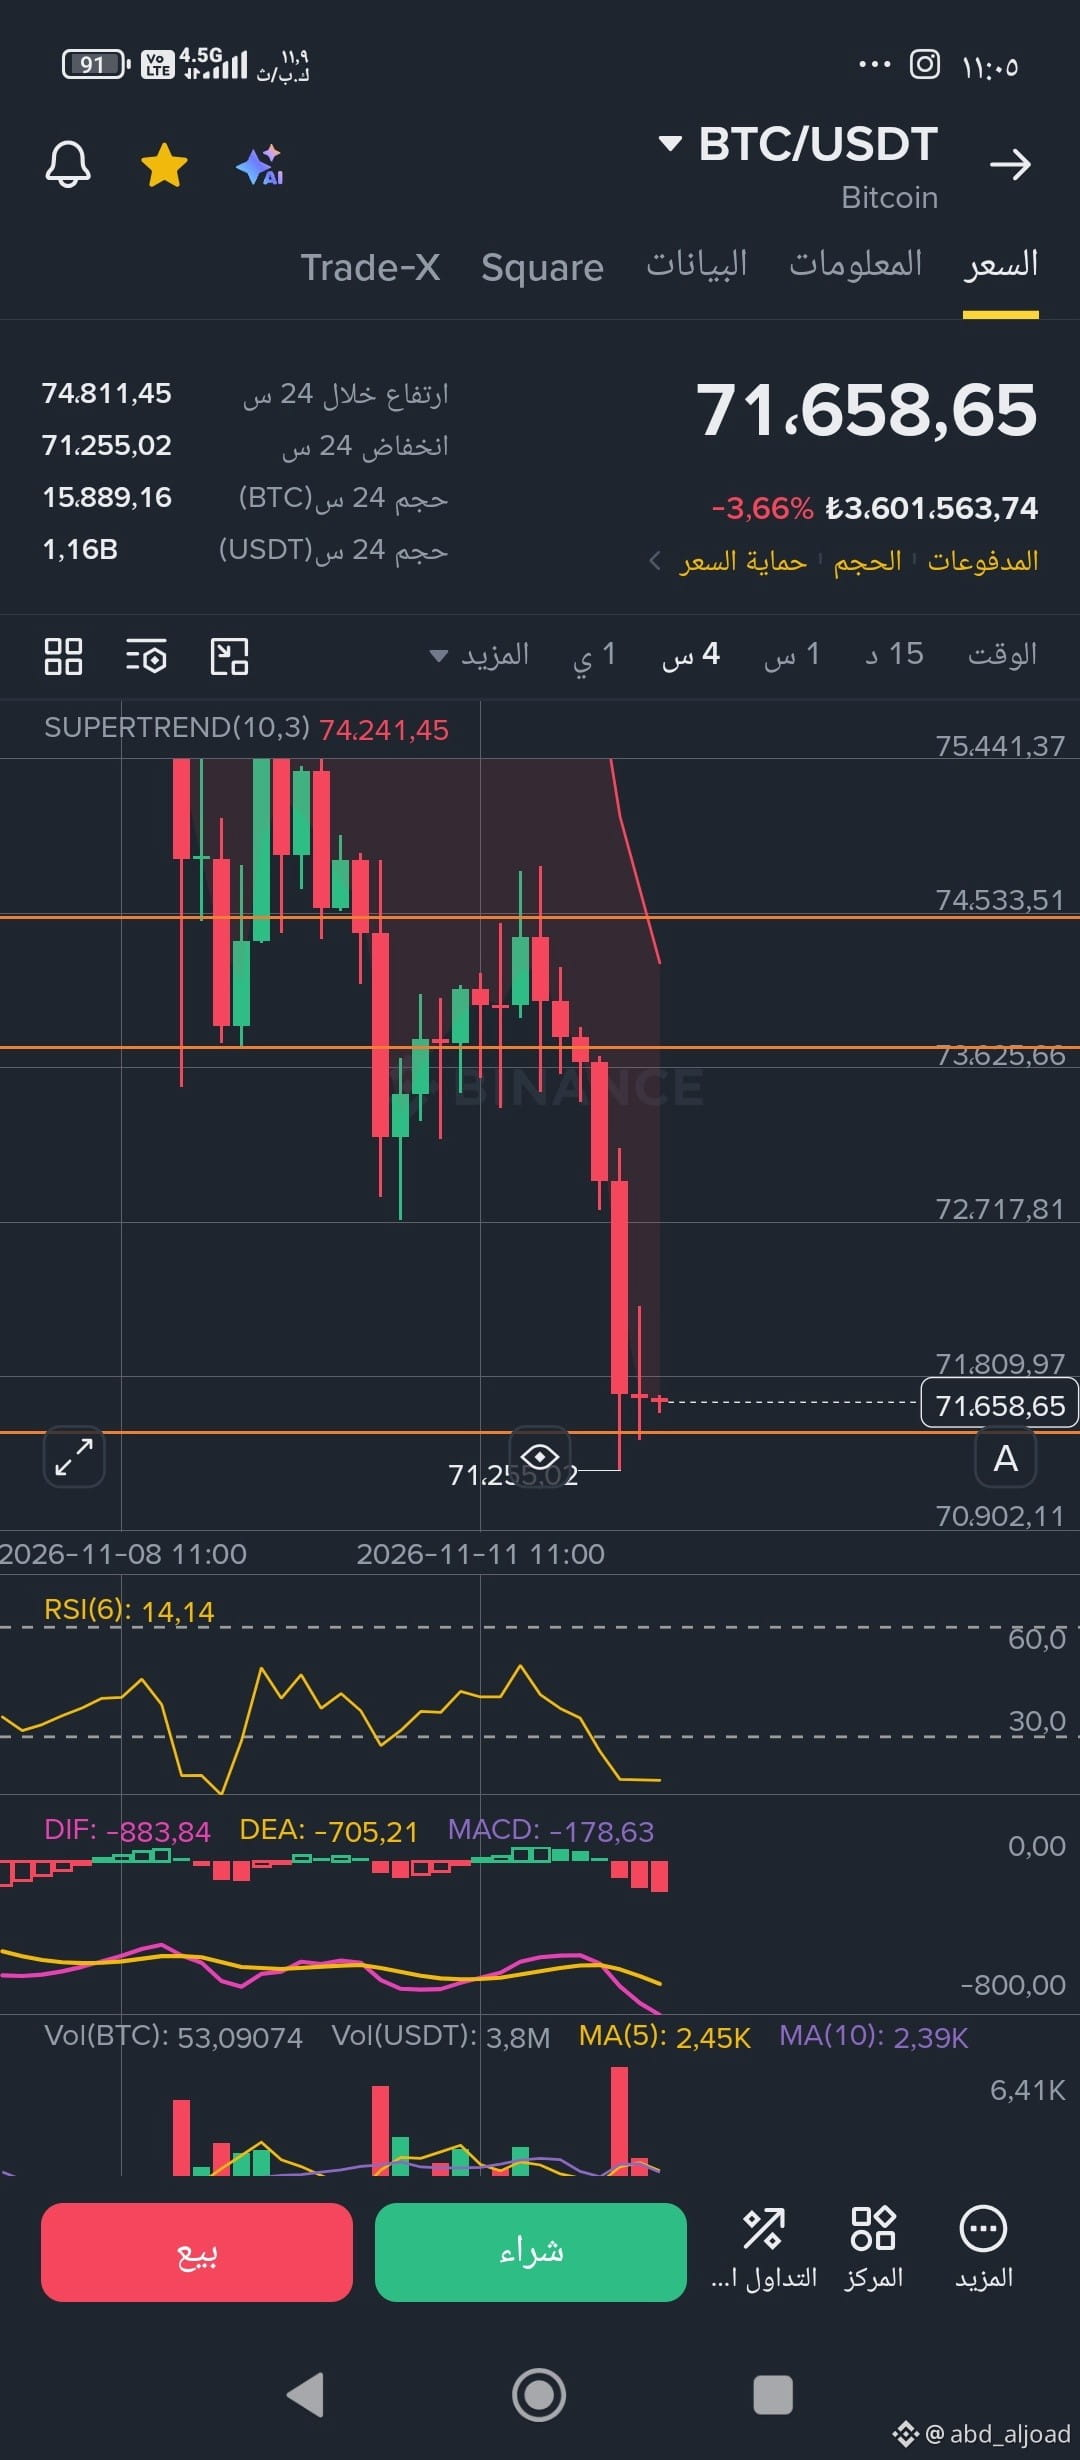
we’ll spare you the task—we’ve marked them for you. Look at the images at the bottom of the post so you can see the significance of this range and where the price ended up after losing its recovery decision levels.
And God knows best.
Good luck to everyone.
👇👇👇
$BNB
$ETH
@
When we say our range is $825 and squeeze it into a narrow band between 74,500 and 73,674, believe me, you’re looking at numbers whose significance may be difficult to grasp at first glance.
When we talk about early signs of recovery, we’re not saying that 74,500 is an absolute recovery zone. Rather, we’re showing you how recovery is tested, and where it might succeed or fail.
Right now, I’m less concerned with the major recovery levels than with the trader who trusted me and followed my analysis. I want to show them where to watch, what to look for, and when they’ll know whether the setup is working or the breakdown is continuing.
I don’t want to drag this out any longer. Open the chart, draw two lines at the decision points we identified, and let the chart show you the significance of this range. God willing, your perspective on it will change.
If you can’t draw the two lines at the key levels and decision points,
we’ll spare you the task—we’ve marked them for you. Look at the images at the bottom of the post so you can see the significance of this range and where the price ended up after losing its recovery decision levels.
And God knows best.
Good luck to everyone.
👇👇👇