$PLAY PlaysOut (4h and 15m charts)
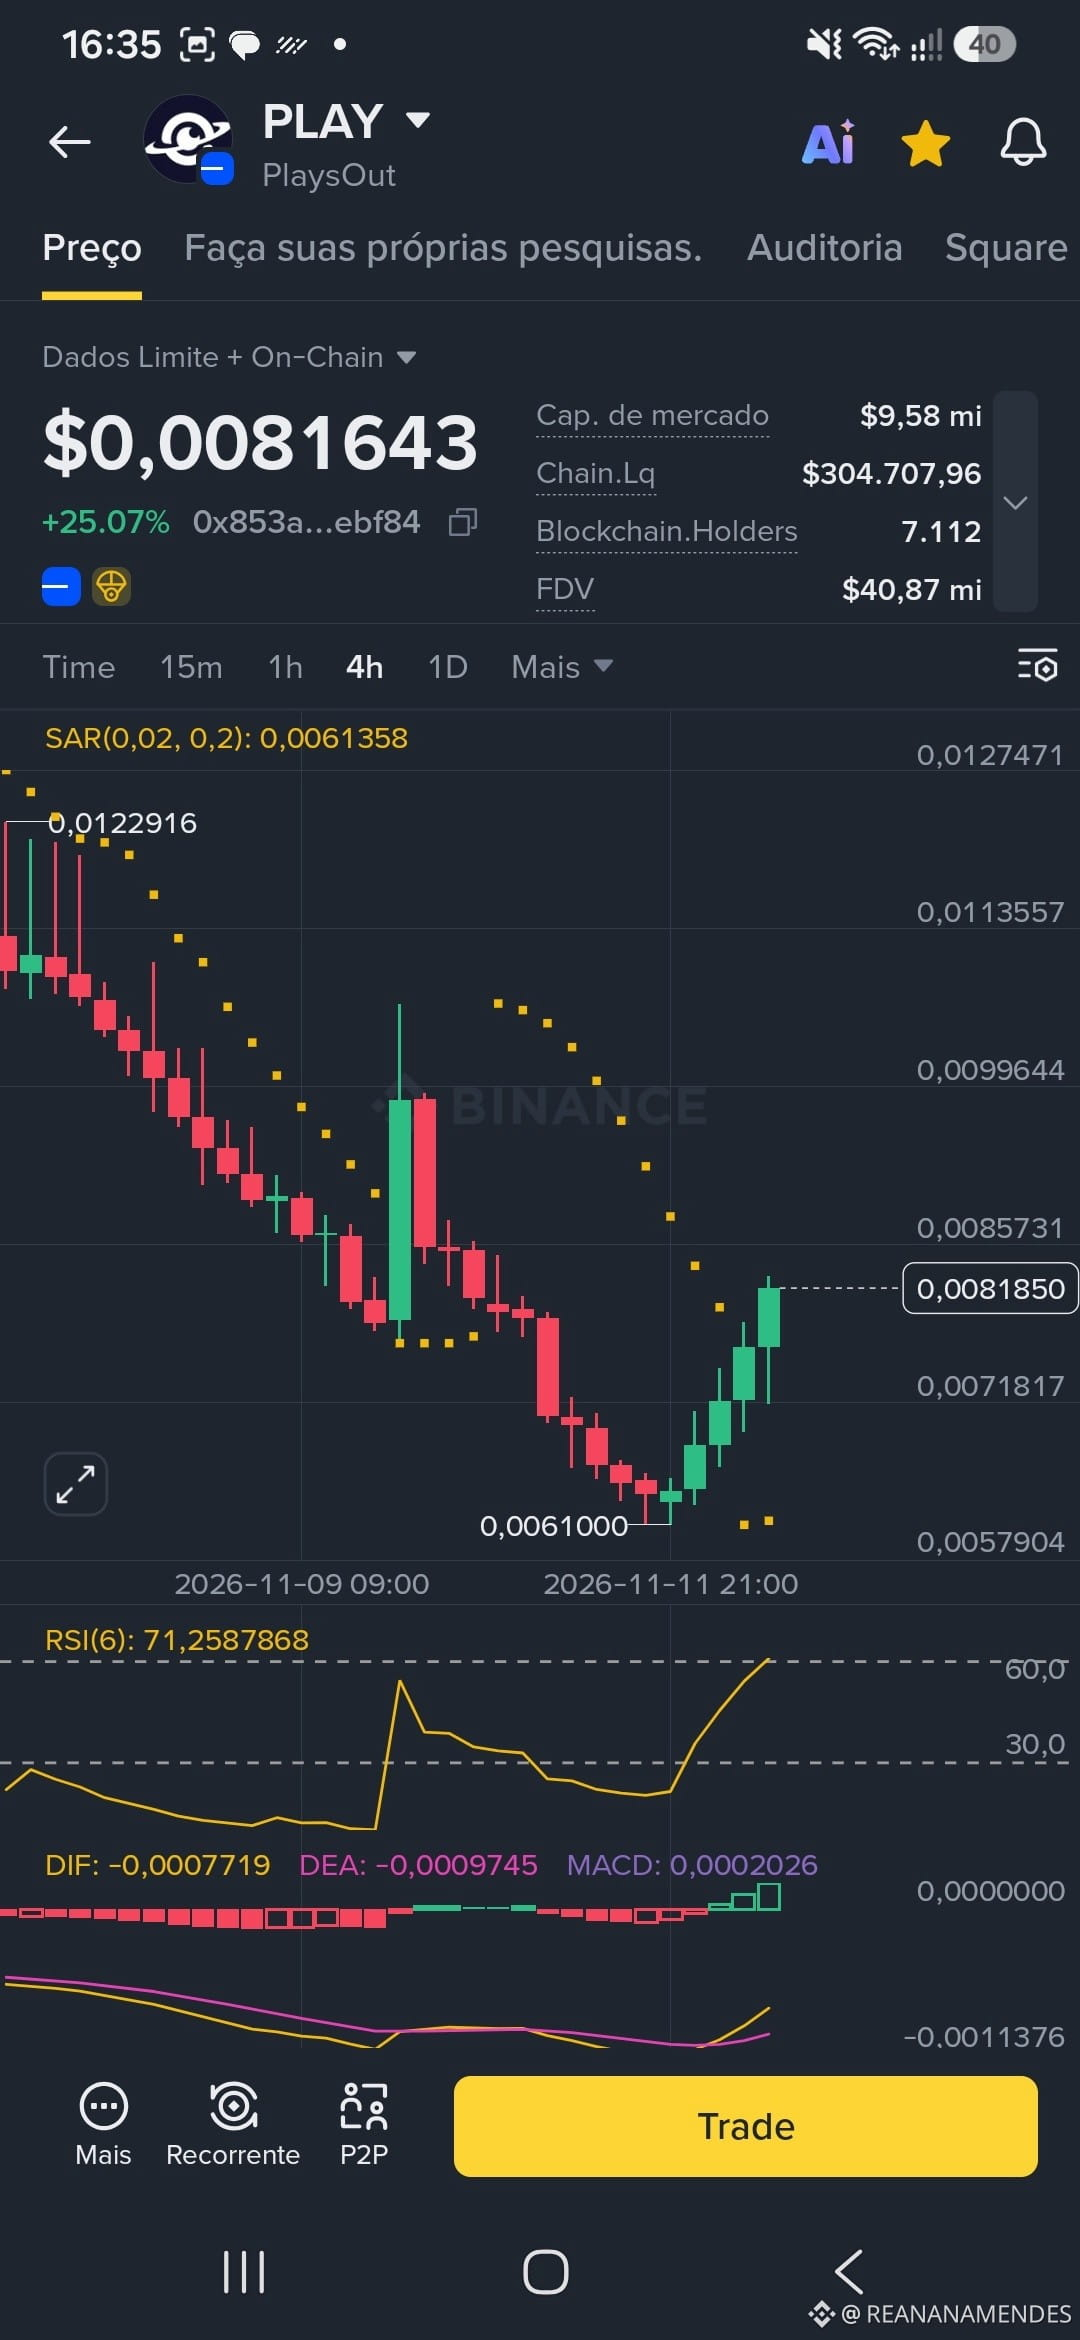
Market Update: After finding a solid bottom around $0.0061, PLAY staged a strong recovery, gaining approximately +24% to +25%, with its market cap around $9.57M–$9.58M.
Technical Analysis (Trader View):
On the 4h chart, the Parabolic SAR indicator flipped below price, confirming a reversal of the previous downtrend.
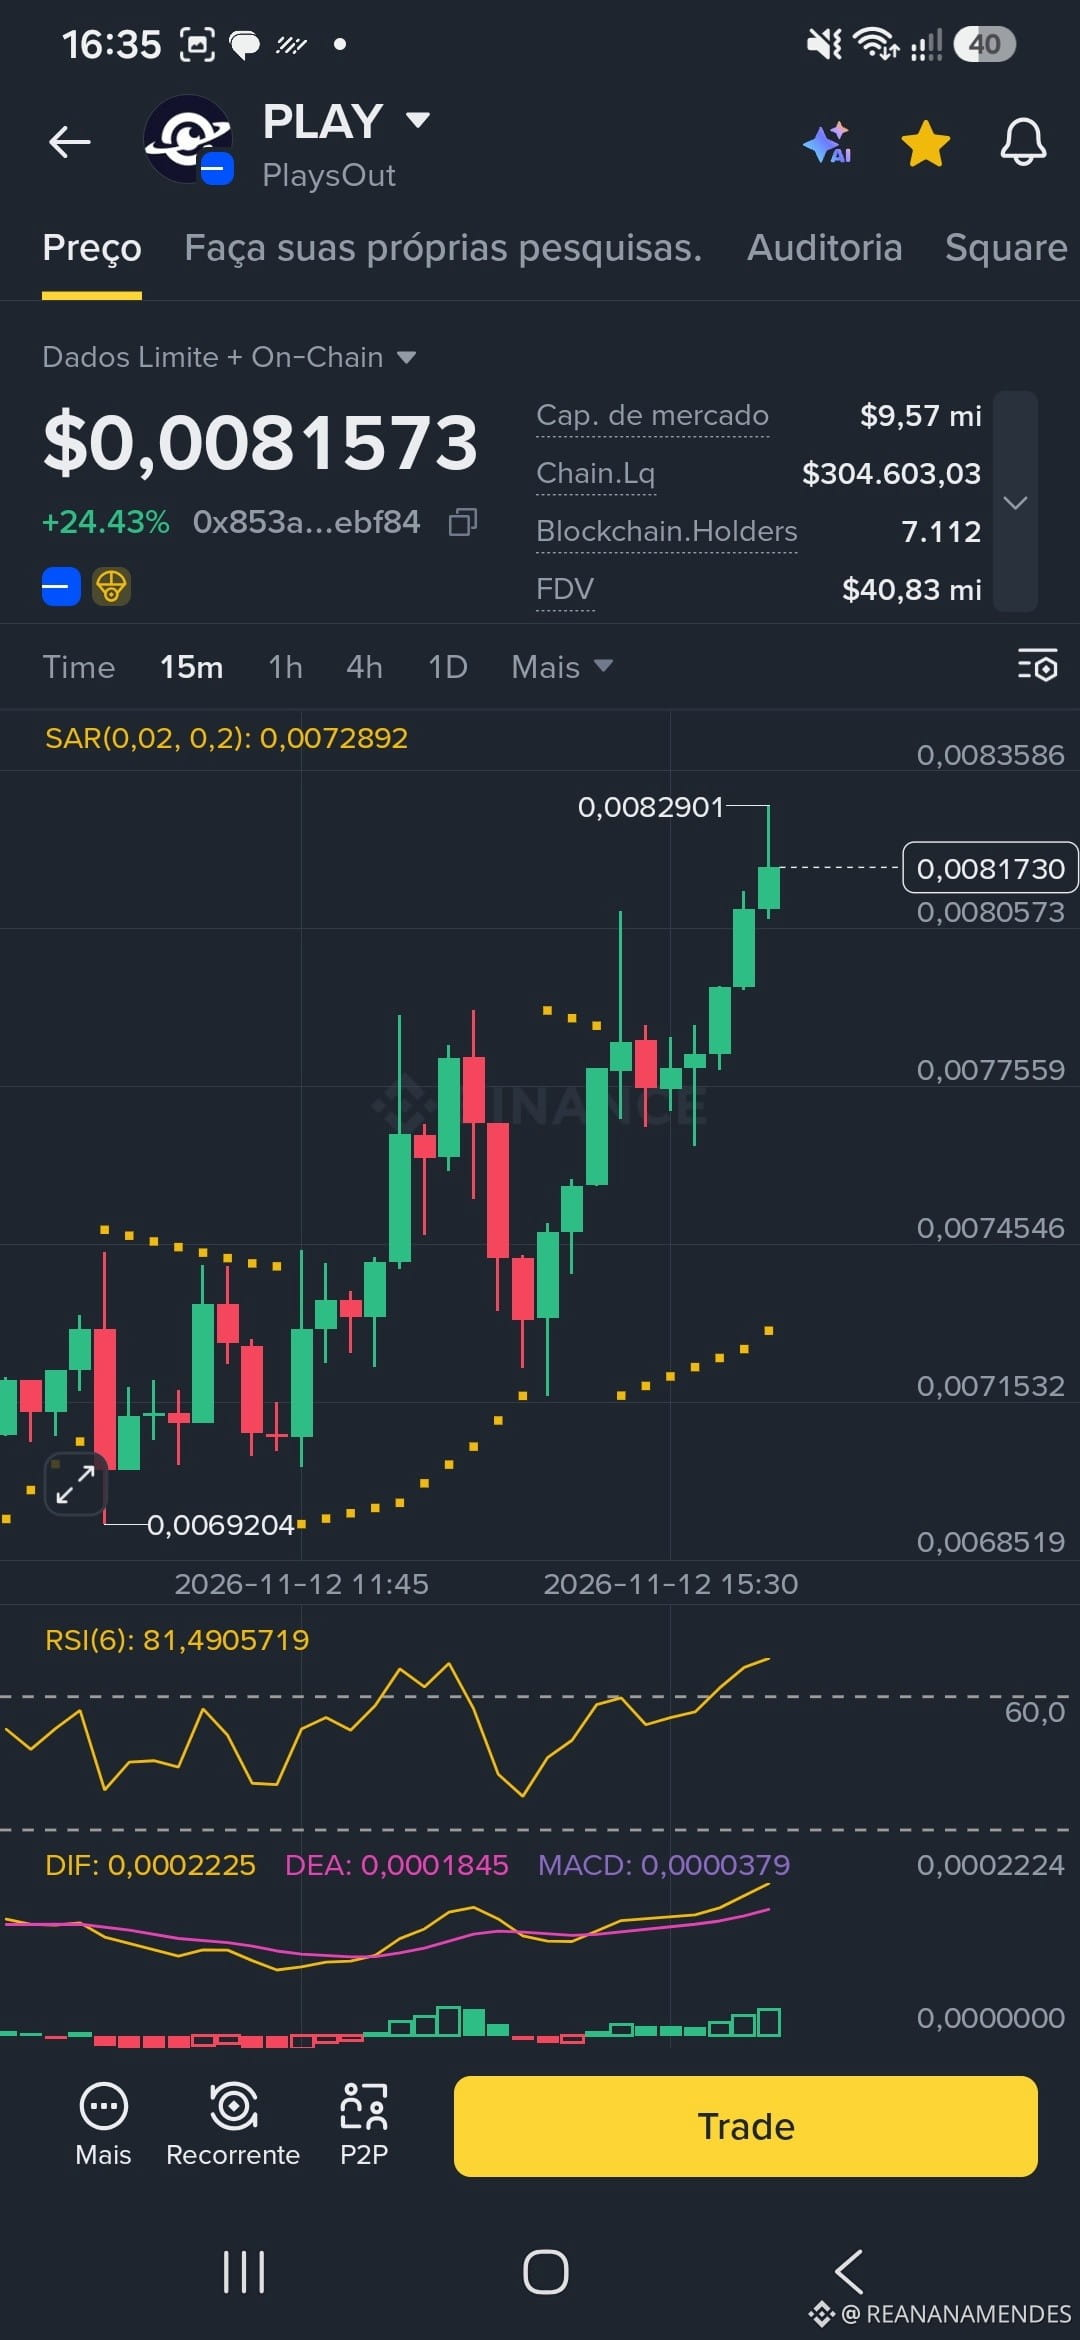
On the 15m chart, the asset made a strong stair-step move up to a high of $0.0290, backed by an elevated RSI(6) (~81) and a bullish MACD crossover, indicating strong short-term buying momentum.
Strategy: Momentum is strongly bullish, but caution is warranted with the RSI stretched. Watch for possible pullbacks to nearby support levels as potential new entry opportunities.
Market Update: After finding a solid bottom around $0.0061, PLAY staged a strong recovery, gaining approximately +24% to +25%, with its market cap around $9.57M–$9.58M.
Technical Analysis (Trader View):
On the 4h chart, the Parabolic SAR indicator flipped below price, confirming a reversal of the previous downtrend.
On the 15m chart, the asset made a strong stair-step move up to a high of $0.0290, backed by an elevated RSI(6) (~81) and a bullish MACD crossover, indicating strong short-term buying momentum.
Strategy: Momentum is strongly bullish, but caution is warranted with the RSI stretched. Watch for possible pullbacks to nearby support levels as potential new entry opportunities.