$BTC
$825… could the candle really line up this perfectly?!
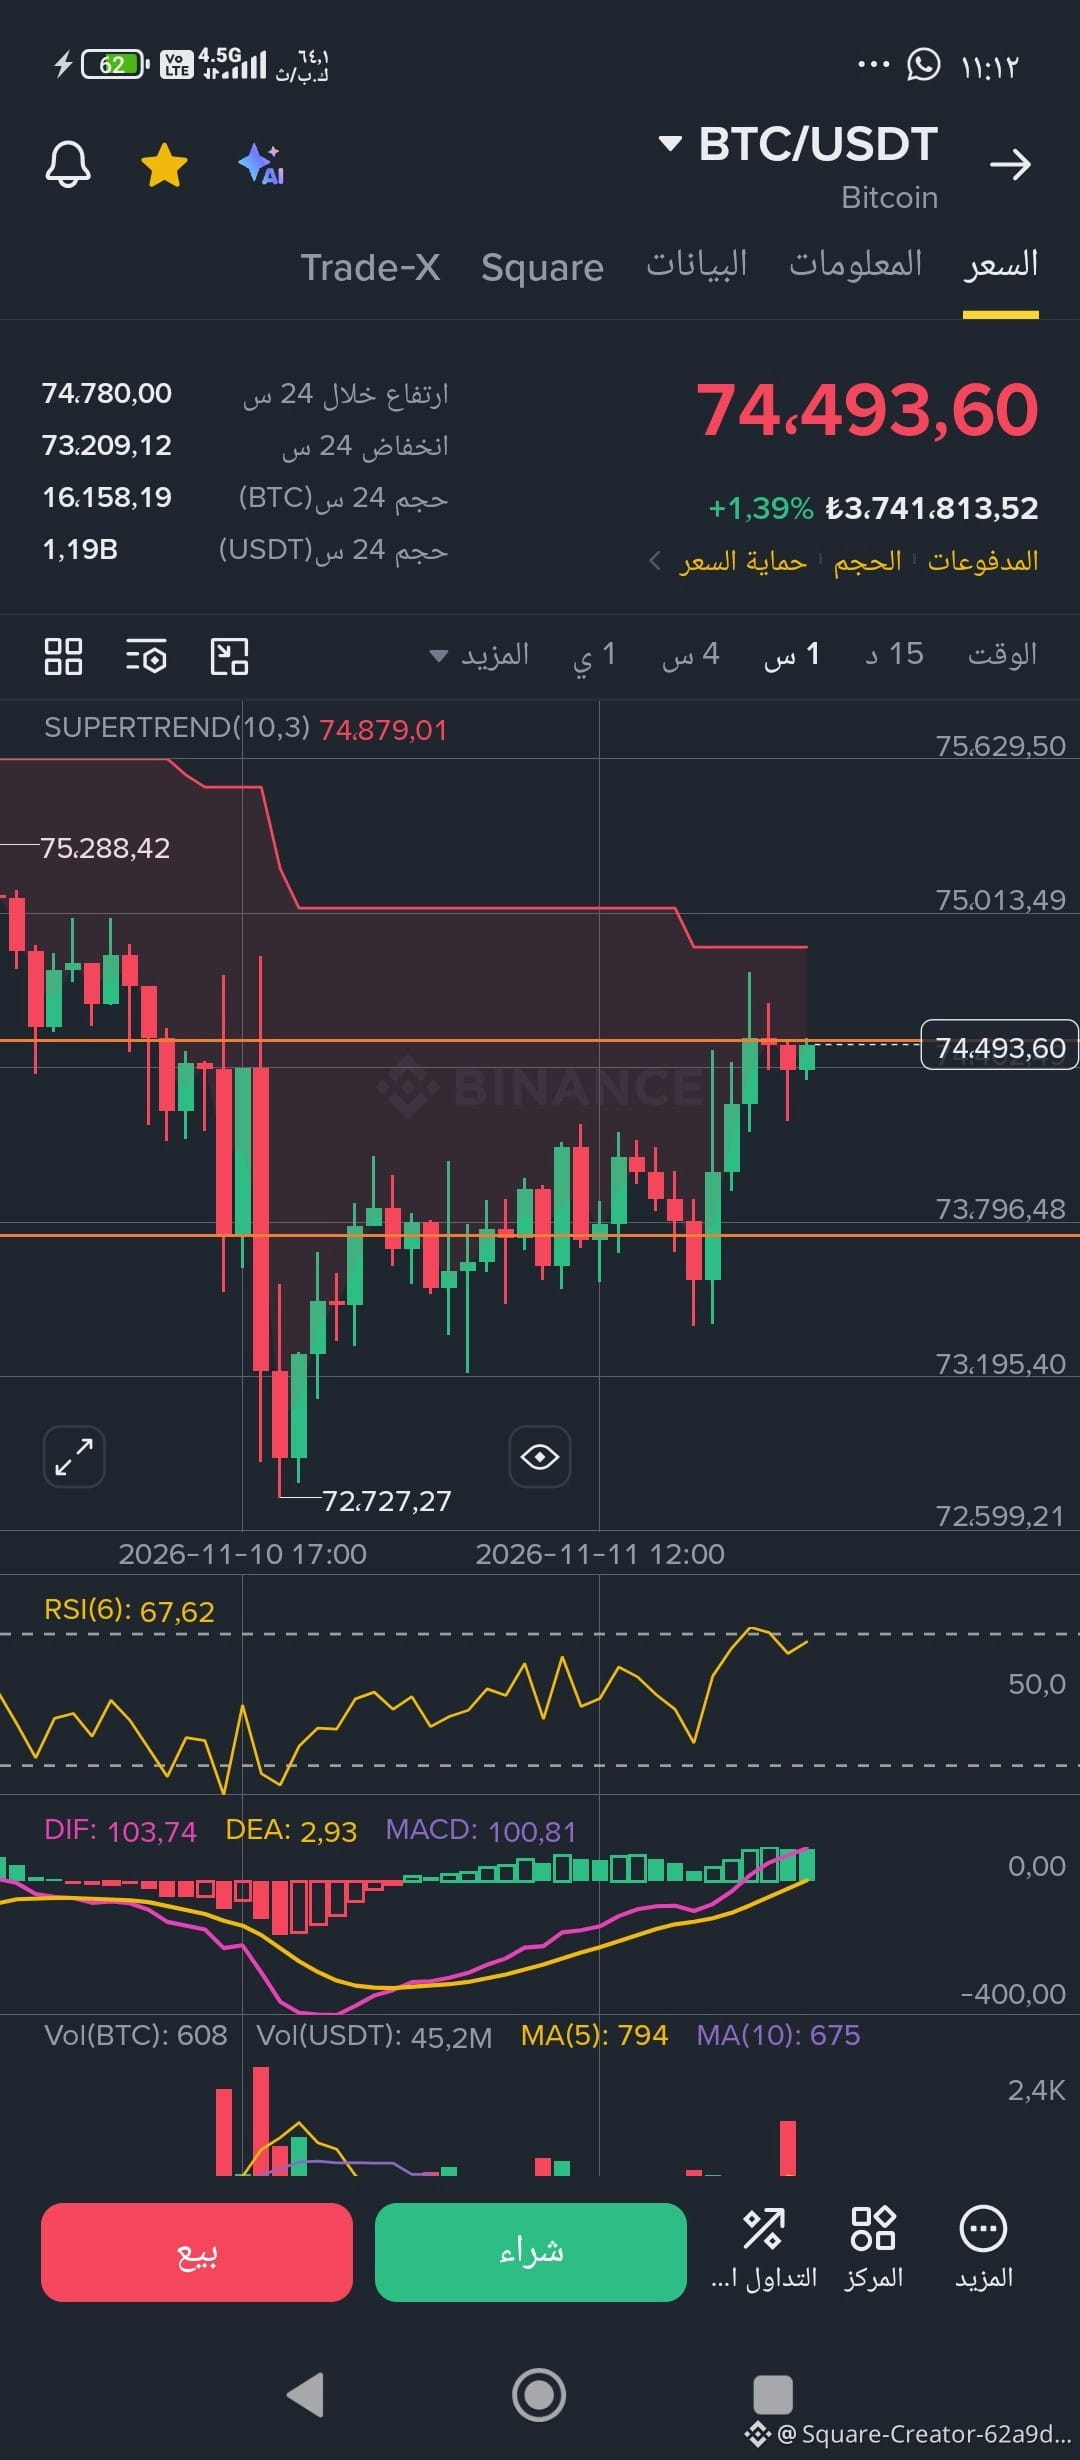
Remember these two numbers well: 74,500 and 73,674.
In the previous post, we identified them as the decision and separation points, and marked the range of conflict between them. Then we let the price move and watched the outcome.
Now look what happened!
A false break below 73,674, followed by a daily close above it. Then a false breakout above 74,500, followed by a reversal back below it.
But the surprise worth pausing over isn’t just the wicks!
Open the chart on the daily timeframe and look at the candle body: its upper edge touches 74,500, and its lower edge touches 73,674!
The candle body, almost in its entirety, traces the boundaries of the range we identified earlier!
Switch to the hourly timeframe to see the details of the struggle, then return to the daily… and let the chart speak.
We’re not talking about guessing the direction here, but about reading market structure and measuring the pressure between buyers and sellers at decision points.
The question is no longer where the price will move within the range, but who will have the strength to break out of it?
This is simply a forward-looking reading from my own approach to measuring the pressure behind structure formation by identifying separation and decision points. These points have no value and mean nothing on the chart when first identified; they become the deciding factor and the point of separation when tested. So I don’t recommend following me.
#TradFiForBeginners
#USJoblessClaimsRise
#CoreWeaveJumps10%On168%RevenueGrowth
#AnthropicRejectsIPODelayValuationinQuestion
#HuangExitNvidiaStrategyInFocus
$PEPE
$825… could the candle really line up this perfectly?!
Remember these two numbers well: 74,500 and 73,674.
In the previous post, we identified them as the decision and separation points, and marked the range of conflict between them. Then we let the price move and watched the outcome.
Now look what happened!
A false break below 73,674, followed by a daily close above it. Then a false breakout above 74,500, followed by a reversal back below it.
But the surprise worth pausing over isn’t just the wicks!
Open the chart on the daily timeframe and look at the candle body: its upper edge touches 74,500, and its lower edge touches 73,674!
The candle body, almost in its entirety, traces the boundaries of the range we identified earlier!
Switch to the hourly timeframe to see the details of the struggle, then return to the daily… and let the chart speak.
We’re not talking about guessing the direction here, but about reading market structure and measuring the pressure between buyers and sellers at decision points.
The question is no longer where the price will move within the range, but who will have the strength to break out of it?
This is simply a forward-looking reading from my own approach to measuring the pressure behind structure formation by identifying separation and decision points. These points have no value and mean nothing on the chart when first identified; they become the deciding factor and the point of separation when tested. So I don’t recommend following me.
#TradFiForBeginners
#USJoblessClaimsRise
#CoreWeaveJumps10%On168%RevenueGrowth
#AnthropicRejectsIPODelayValuationinQuestion
#HuangExitNvidiaStrategyInFocus
$PEPE