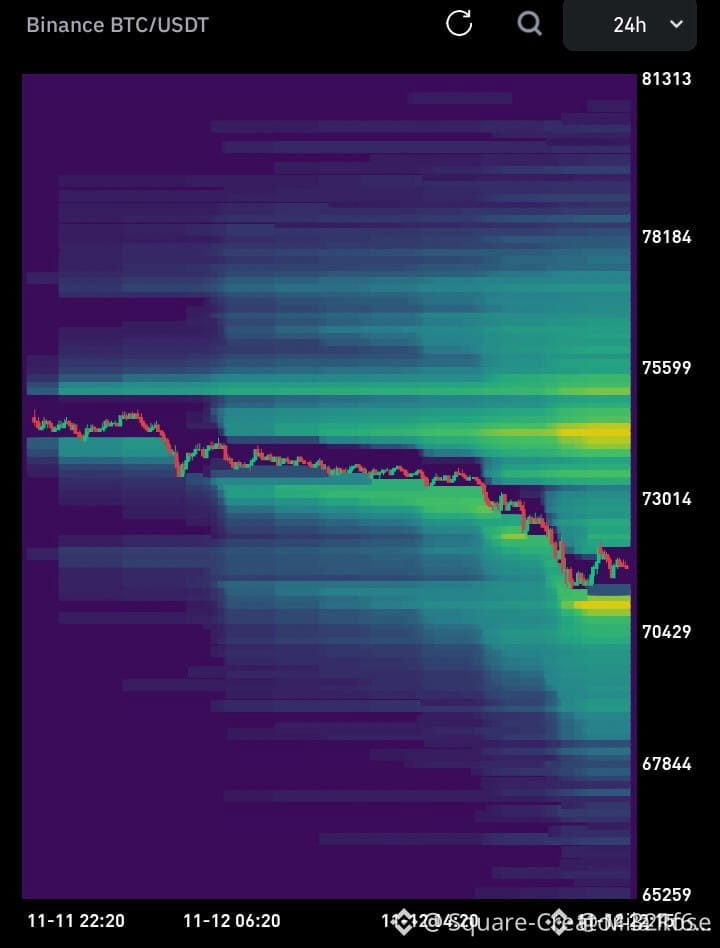
$BTC Liquidation map: Support test reaches $71.4K as resistance shifts to $74.2–75.5K
The map shows Bitcoin retreating from the $73,800–$74,000 consolidation range, liquidating leveraged long positions at lower levels down to $71,360, before stabilizing around $71,700.
Macro target liquidity zones:
Downside: Secondary structural liquidity extends lower, toward $67,844 and $65,259.
Upside extension: Higher targets at $78,184 and $81,313 remain in play.
Bitcoin flushed out leveraged long positions at lower levels, reaching $71.4K. Holding the $70.8K–$71.5K support base keeps a bounce in play, potentially clearing accumulated short-position liquidity above the price between $73.0K and $75.5K.
Would you buy the dip to $71.4K in preparation for a quick bounce toward $74K or higher, or do you expect a bearish breakdown to test $67.8K? Share your plan below
#BTC☀
The map shows Bitcoin retreating from the $73,800–$74,000 consolidation range, liquidating leveraged long positions at lower levels down to $71,360, before stabilizing around $71,700.
Macro target liquidity zones:
Downside: Secondary structural liquidity extends lower, toward $67,844 and $65,259.
Upside extension: Higher targets at $78,184 and $81,313 remain in play.
Bitcoin flushed out leveraged long positions at lower levels, reaching $71.4K. Holding the $70.8K–$71.5K support base keeps a bounce in play, potentially clearing accumulated short-position liquidity above the price between $73.0K and $75.5K.
Would you buy the dip to $71.4K in preparation for a quick bounce toward $74K or higher, or do you expect a bearish breakdown to test $67.8K? Share your plan below
#BTC☀