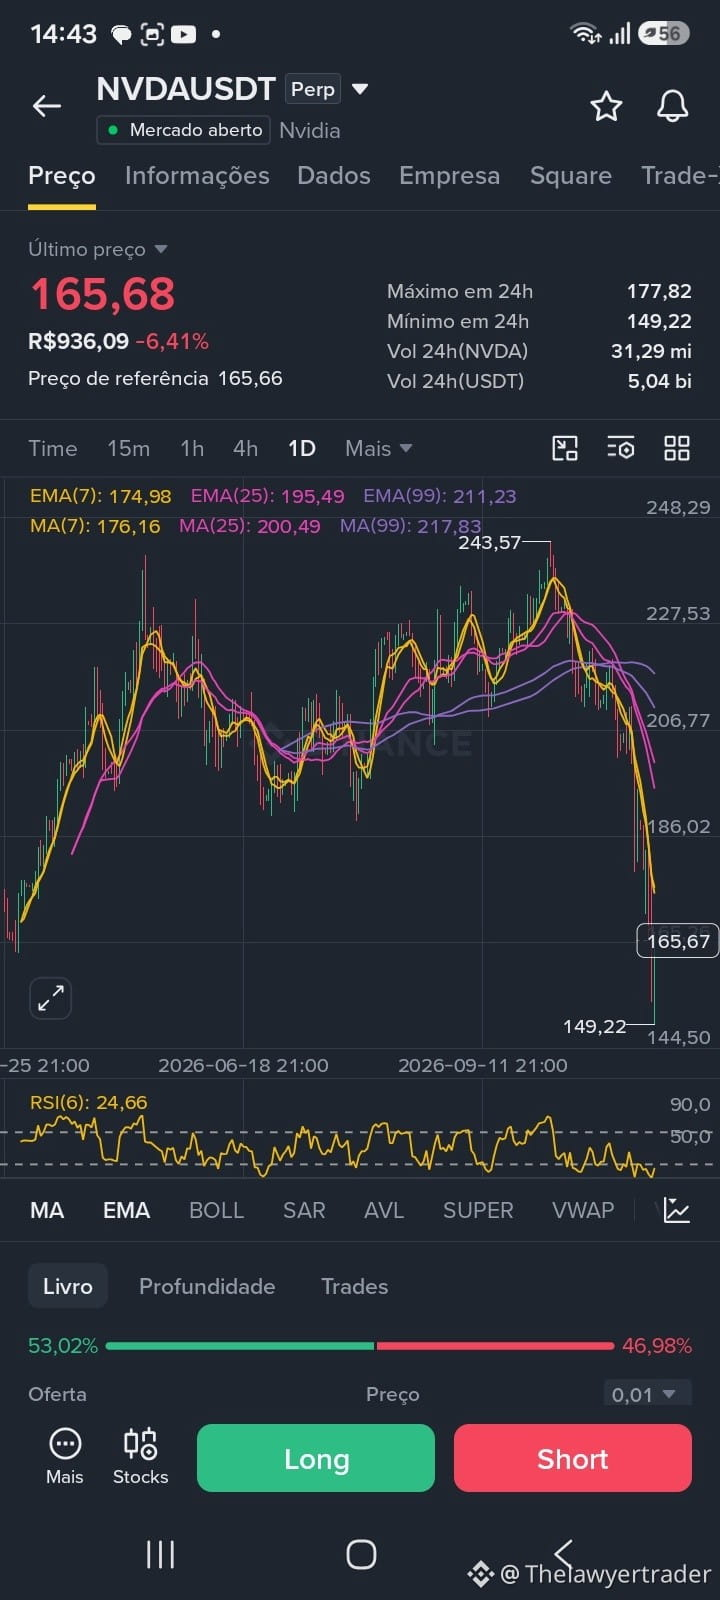
NVDA/USDT — technical analysis (daily)
Price at 165.68, down 6.41% over the last 24 hours, with a high of 177.82 and a low of 149.22. High volume, at 5.04 billion USDT.
Main support: 149.22, the recent low. It is the only visible technical floor below the current price.
Main resistance: 174.98 to 177.82, the range of the EMA7 and the day's high. Above that, 195.49 to 200.49 is where the EMA25 and MA25 converge.
Chart pattern: a downward breakout after sideways consolidation, with a simultaneous loss of the short- and long-term moving averages and a sequence of falling candles. This is a support breakdown with acceleration, not a bottom formation. The RSI(6) at 24.66 indicates deep oversold conditions, suggesting an extended sell-off without confirming a reversal. The outlook only changes with a close above 195.49.
A detail to note: this is a perpetual contract, with funding costs and the risk of liquidation due to leverage.
This content is a technical analysis of price structure and does not constitute an investment recommendation. Support and resistance are probability-based reference points, not guarantees, and every decision involves the risk of loss.
$NVDAB
Price at 165.68, down 6.41% over the last 24 hours, with a high of 177.82 and a low of 149.22. High volume, at 5.04 billion USDT.
Main support: 149.22, the recent low. It is the only visible technical floor below the current price.
Main resistance: 174.98 to 177.82, the range of the EMA7 and the day's high. Above that, 195.49 to 200.49 is where the EMA25 and MA25 converge.
Chart pattern: a downward breakout after sideways consolidation, with a simultaneous loss of the short- and long-term moving averages and a sequence of falling candles. This is a support breakdown with acceleration, not a bottom formation. The RSI(6) at 24.66 indicates deep oversold conditions, suggesting an extended sell-off without confirming a reversal. The outlook only changes with a close above 195.49.
A detail to note: this is a perpetual contract, with funding costs and the risk of liquidation due to leverage.
This content is a technical analysis of price structure and does not constitute an investment recommendation. Support and resistance are probability-based reference points, not guarantees, and every decision involves the risk of loss.
$NVDAB