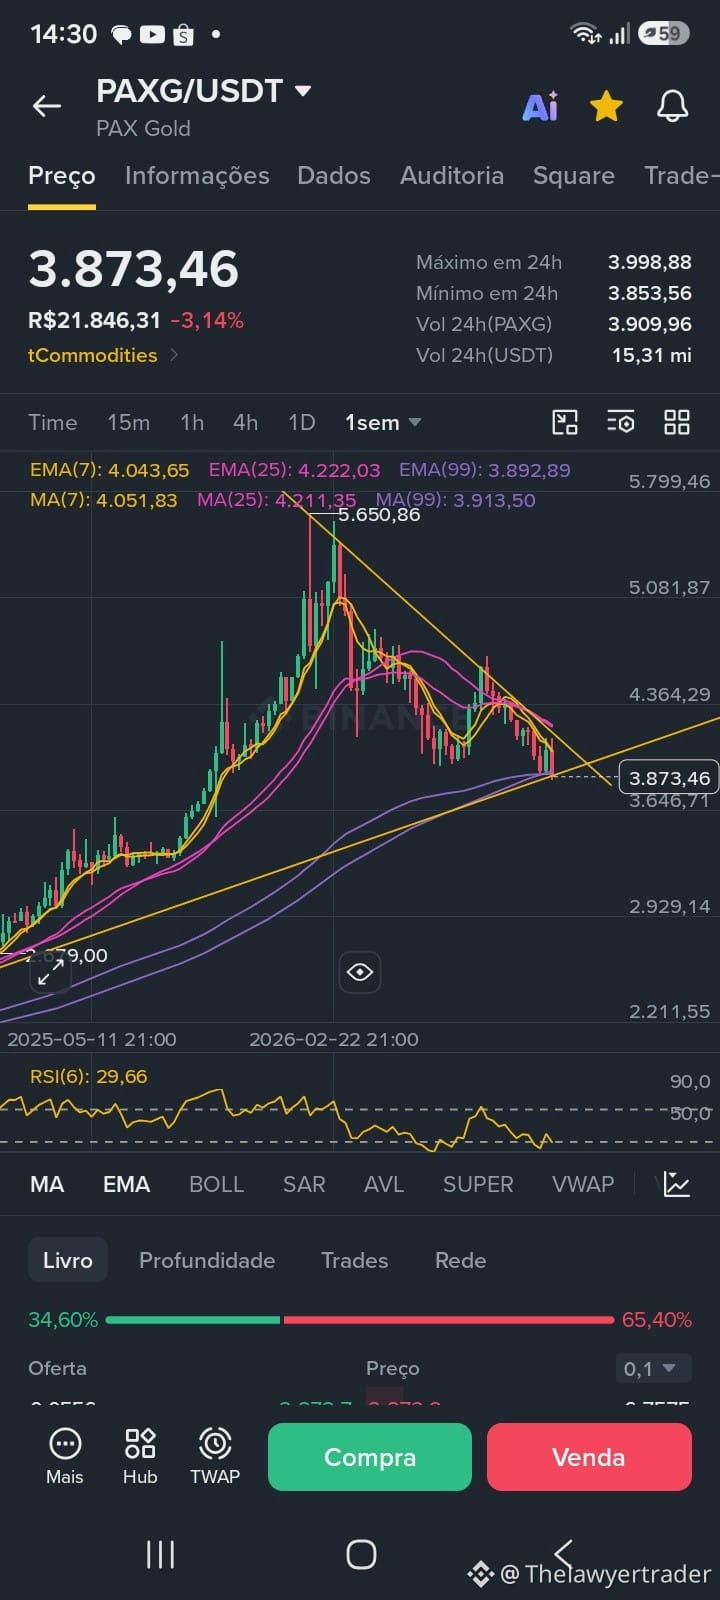
PAXG/USDT — technical analysis (1 week)
Price at 3,873.46 USDT, down 3.14% over the past 24 hours, with a high of 3,998.88 and a low of 3,853.56.
Main support: range from 3,646 to 3,890, where the long-term uptrend line meets the EMA99 (3,892.89). This is the current battleground.
Main resistance: 4,043 to 4,222, the EMA7 and EMA25 region, with lower highs since the all-time high of 5,650.86.
Chart pattern: descending triangle, with lower highs compressed against the rising baseline. The RSI(6) at 29.66 is oversold, indicating extended selling pressure without confirming a reversal. The pattern is only confirmed by a decisive break of support.
Keep in mind that PAXG is backed by gold, so it follows the metal and the dollar more closely than the overall crypto market flow.
This content is a technical analysis of price structure and does not constitute investment advice. Support and resistance levels are probability references, not guarantees, and every decision involves the risk of loss.
#PAXGU #PAXGTutorialanalysis $PAXG
Price at 3,873.46 USDT, down 3.14% over the past 24 hours, with a high of 3,998.88 and a low of 3,853.56.
Main support: range from 3,646 to 3,890, where the long-term uptrend line meets the EMA99 (3,892.89). This is the current battleground.
Main resistance: 4,043 to 4,222, the EMA7 and EMA25 region, with lower highs since the all-time high of 5,650.86.
Chart pattern: descending triangle, with lower highs compressed against the rising baseline. The RSI(6) at 29.66 is oversold, indicating extended selling pressure without confirming a reversal. The pattern is only confirmed by a decisive break of support.
Keep in mind that PAXG is backed by gold, so it follows the metal and the dollar more closely than the overall crypto market flow.
This content is a technical analysis of price structure and does not constitute investment advice. Support and resistance levels are probability references, not guarantees, and every decision involves the risk of loss.
#PAXGU #PAXGTutorialanalysis $PAXG