$ETH Crypto Academician: 11.13 Ethereum (ETH) Daily Candles Under Continued Bearish Pressure, Four-Hour Chart Shows a Weak Recovery: The Long-Short Divide Is Clear—Who Will Step In at the 2,000 Level?
The closer price gets to support, the more you should replace “buying the bottom” with “testing the waters.” No one can buy at the exact low. All you can do is test the market with a small position at a relatively low price: if you’re wrong, you lose less; if you’re right, you can add to your position. Don’t go all-in just because you see a rebound, and don’t lose all hope just because price pulls back. The daily chart has not fully turned bullish, and the four-hour chart is only showing signs of stabilizing. Signals need to be confirmed step by step. If you’re holding a position, decide in advance where your stop-loss will be. Starting with a small position limits potential losses.
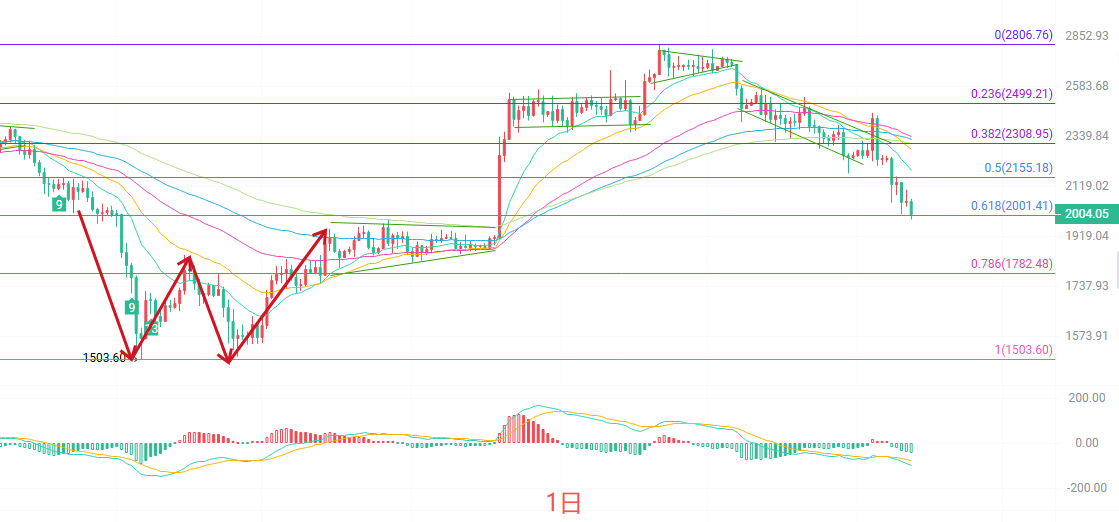
Since pulling back from its daily-candle high, price has printed consecutive bearish candles. It has fallen below several short- and medium-term EMA lines, while the EMA90 and EMA120, both at 2,306, are overhead and adding layers of resistance. The MACD lines are below the zero axis and the green histogram bars continue, so bearish momentum has yet to show clear signs of exhaustion. The Bollinger Bands are opening downward, with price trading near the lower band at 2,022. Overall, the daily structure remains in a weak correction. In the short term, watch whether the 1,980 area holds; a break below it would open up further downside.
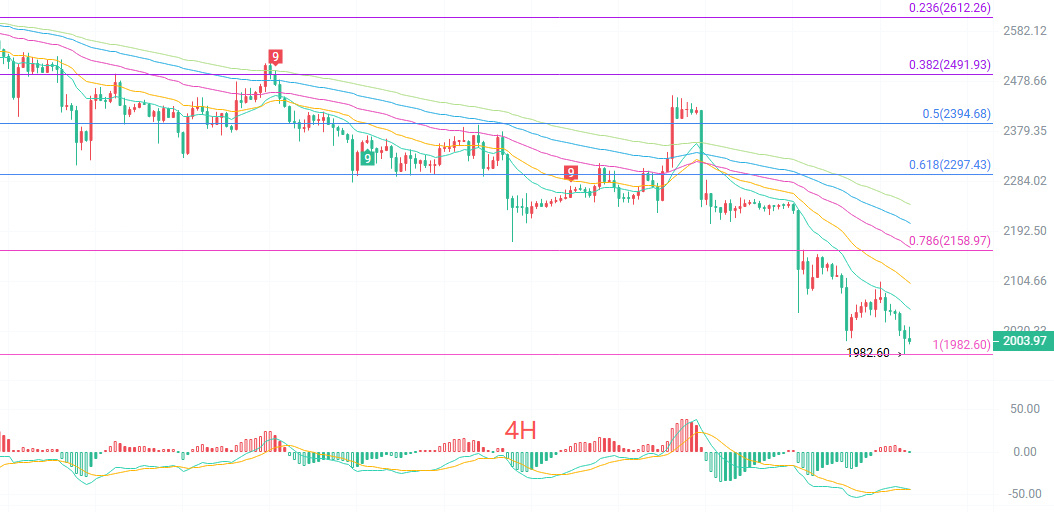
After marking a short-term low at 1,982, the four-hour chart has seen a modest rebound, but price is still below the EMA15, EMA30, and EMA60. The EMA90 at 2,207 and EMA120 at 2,242 are much further overhead as resistance, with the moving averages in a bearish alignment. The MACD green bars have contracted somewhat and the two lines are converging at low levels, suggesting the market may be stabilizing and consolidating in the short term, but no clear bullish crossover reversal has formed yet. The lower Bollinger Band is at 1,990, and price is trading between the middle and lower bands. On the four-hour timeframe, this is a weak recovery after a decline. Unless the rebound can reclaim the 2,058 area, the market is still likely to trade weakly and sideways.
Short-term levels to watch:
Long: 1,960–1,930 if support holds; stop-loss 30 points; target 2,000–2,050.
Short: 2,050–2,100 if upward momentum stalls; stop-loss 30 points; target 2,000–1,950.
For specific trades, rely on real-time order book data. For more information, contact the author. This article may be published with a delay and is for reference only. Trade at your own risk.
#ETH走势分析
The closer price gets to support, the more you should replace “buying the bottom” with “testing the waters.” No one can buy at the exact low. All you can do is test the market with a small position at a relatively low price: if you’re wrong, you lose less; if you’re right, you can add to your position. Don’t go all-in just because you see a rebound, and don’t lose all hope just because price pulls back. The daily chart has not fully turned bullish, and the four-hour chart is only showing signs of stabilizing. Signals need to be confirmed step by step. If you’re holding a position, decide in advance where your stop-loss will be. Starting with a small position limits potential losses.
Since pulling back from its daily-candle high, price has printed consecutive bearish candles. It has fallen below several short- and medium-term EMA lines, while the EMA90 and EMA120, both at 2,306, are overhead and adding layers of resistance. The MACD lines are below the zero axis and the green histogram bars continue, so bearish momentum has yet to show clear signs of exhaustion. The Bollinger Bands are opening downward, with price trading near the lower band at 2,022. Overall, the daily structure remains in a weak correction. In the short term, watch whether the 1,980 area holds; a break below it would open up further downside.
After marking a short-term low at 1,982, the four-hour chart has seen a modest rebound, but price is still below the EMA15, EMA30, and EMA60. The EMA90 at 2,207 and EMA120 at 2,242 are much further overhead as resistance, with the moving averages in a bearish alignment. The MACD green bars have contracted somewhat and the two lines are converging at low levels, suggesting the market may be stabilizing and consolidating in the short term, but no clear bullish crossover reversal has formed yet. The lower Bollinger Band is at 1,990, and price is trading between the middle and lower bands. On the four-hour timeframe, this is a weak recovery after a decline. Unless the rebound can reclaim the 2,058 area, the market is still likely to trade weakly and sideways.
Short-term levels to watch:
Long: 1,960–1,930 if support holds; stop-loss 30 points; target 2,000–2,050.
Short: 2,050–2,100 if upward momentum stalls; stop-loss 30 points; target 2,000–1,950.
For specific trades, rely on real-time order book data. For more information, contact the author. This article may be published with a delay and is for reference only. Trade at your own risk.
#ETH走势分析