$BTC Crypto Academician: 11.13 Bitcoin (BTC) Being Oversold Doesn’t Mean It Has Bottomed: After the Daily Candle Breaks Below the Lower Band, Three Confirmation Signals Technical Analysis Truly Needs to Wait For
Short-term trading profits come from timing, not from guessing tops and bottoms. When you feel the urge to trade, ask yourself first: Has the price reached the level? Has the signal appeared? Is the stop-loss set? If you can’t answer even one of these three questions, don’t trade. The rebound after a sharp drop is most likely to fool you: it looks like a reversal, but is really just a chance to catch its breath. Don’t chase longs after a big bullish candle, and don’t chase shorts after a panic sell-off. Wait for the price to reach your planned level before acting.
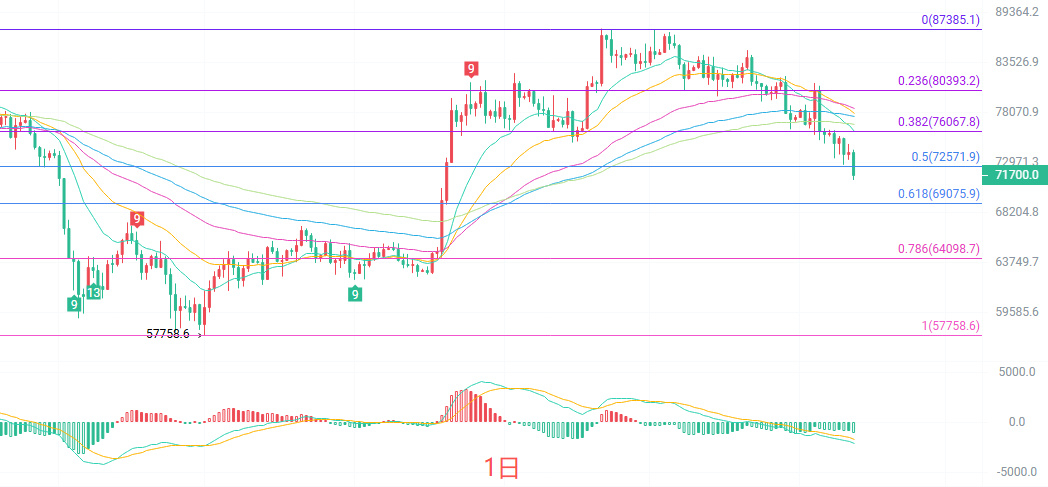
The daily candlestick is a medium-sized bearish candle with a lower shadow. All five EMA lines are above the current price, a typical bearish setup; the price hasn’t even managed to reclaim the shortest EMA15. On the MACD, the two lines continue to diverge below the zero line, and bearish momentum is still being released. The Bollinger Band midline is 77329, the upper band is 82569, and the lower band is 72088. The current price of 71930 has already slipped below the lower band, so it is short-term oversold—but being oversold doesn’t mean it has bottomed. Overall, the daily chart still shows a structure of rebounds meeting resistance and the center of gravity moving lower. No stabilization signal has appeared yet.
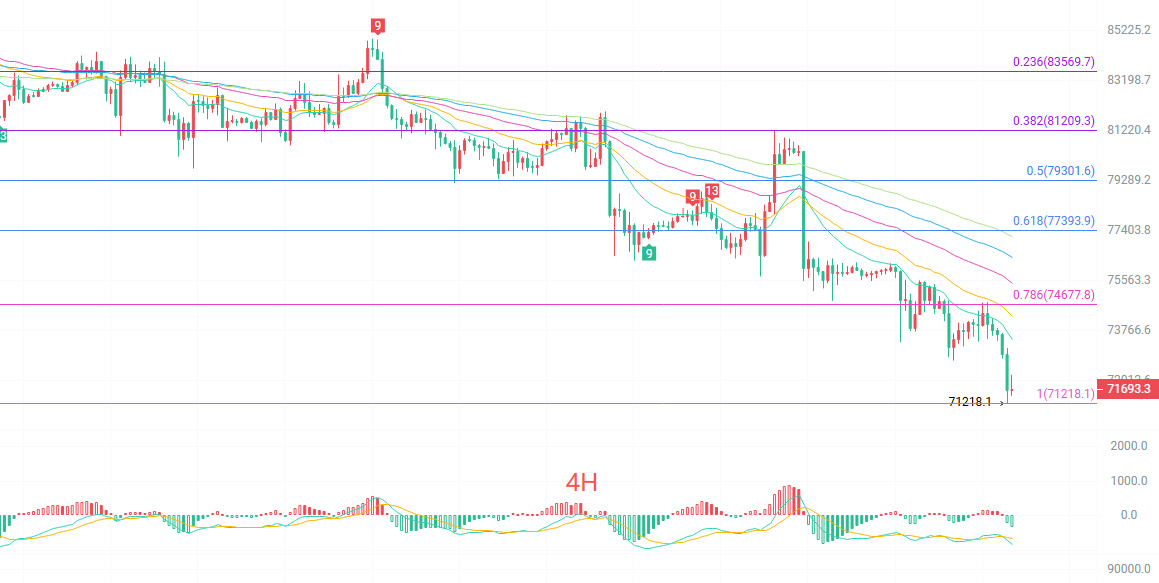
The four-hour candlestick is a small bullish candle showing a slight rebound. The price is trading below all the moving averages, which are bearishly aligned. Compared with the previous sharp decline, the MACD has contracted somewhat, suggesting that short-term selling pressure is easing and a technical rebound is possible. However, the two lines are still below the zero line, so any rebound is more likely to be a correction during a downtrend than a trend reversal. The Bollinger Band lower band is 72000, the midline is 73890, and the upper band is 75781. The current price is right at the lower-band edge. The TD indicator reads 6, so the downward count is not yet complete. Watch whether the rebound can reclaim the short-term moving averages around 73400.
Short-term reference:
Long: 71200 to 70700, if support holds; stop-loss 500 points, target 72000 to 73000.
Short: 73500 to 74000, if upward momentum stalls; stop-loss 500 points, target 73000 to 72000.
For specific trades, rely on real-time order-book data. For more information, you can contact the author. Articles are published with a delay; this is for reference only, and you assume all risks.
#BTC走势分析
Short-term trading profits come from timing, not from guessing tops and bottoms. When you feel the urge to trade, ask yourself first: Has the price reached the level? Has the signal appeared? Is the stop-loss set? If you can’t answer even one of these three questions, don’t trade. The rebound after a sharp drop is most likely to fool you: it looks like a reversal, but is really just a chance to catch its breath. Don’t chase longs after a big bullish candle, and don’t chase shorts after a panic sell-off. Wait for the price to reach your planned level before acting.
The daily candlestick is a medium-sized bearish candle with a lower shadow. All five EMA lines are above the current price, a typical bearish setup; the price hasn’t even managed to reclaim the shortest EMA15. On the MACD, the two lines continue to diverge below the zero line, and bearish momentum is still being released. The Bollinger Band midline is 77329, the upper band is 82569, and the lower band is 72088. The current price of 71930 has already slipped below the lower band, so it is short-term oversold—but being oversold doesn’t mean it has bottomed. Overall, the daily chart still shows a structure of rebounds meeting resistance and the center of gravity moving lower. No stabilization signal has appeared yet.
The four-hour candlestick is a small bullish candle showing a slight rebound. The price is trading below all the moving averages, which are bearishly aligned. Compared with the previous sharp decline, the MACD has contracted somewhat, suggesting that short-term selling pressure is easing and a technical rebound is possible. However, the two lines are still below the zero line, so any rebound is more likely to be a correction during a downtrend than a trend reversal. The Bollinger Band lower band is 72000, the midline is 73890, and the upper band is 75781. The current price is right at the lower-band edge. The TD indicator reads 6, so the downward count is not yet complete. Watch whether the rebound can reclaim the short-term moving averages around 73400.
Short-term reference:
Long: 71200 to 70700, if support holds; stop-loss 500 points, target 72000 to 73000.
Short: 73500 to 74000, if upward momentum stalls; stop-loss 500 points, target 73000 to 72000.
For specific trades, rely on real-time order-book data. For more information, you can contact the author. Articles are published with a delay; this is for reference only, and you assume all risks.
#BTC走势分析