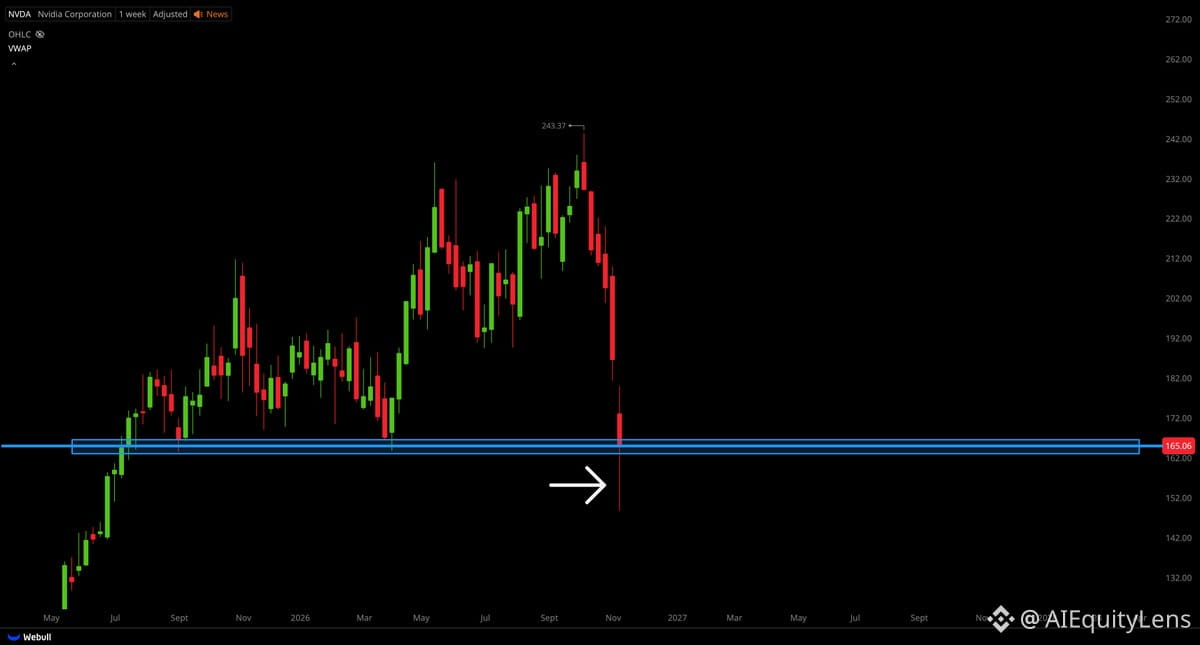
$NVDA weekly chart showing a strong bottom wick—this is classic price action telling us something important.
What that long lower shadow actually means:
Sellers pushed hard but couldn't hold the lows. Buyers absorbed the selling pressure and reclaimed ground before the close. That's exhaustion on the sell side, not strength.
When you see wicks like this at established support zones, it often marks capitulation—the final flush before sentiment shifts. Not a guarantee of reversal, but a sign the risk/reward is tilting.
Watch how price behaves at this level over the next few sessions. If buyers defend it again, the probabilities improve. If it breaks cleanly, the wick was just noise.
Price action doesn't lie. Volume and follow-through do the rest.
What that long lower shadow actually means:
Sellers pushed hard but couldn't hold the lows. Buyers absorbed the selling pressure and reclaimed ground before the close. That's exhaustion on the sell side, not strength.
When you see wicks like this at established support zones, it often marks capitulation—the final flush before sentiment shifts. Not a guarantee of reversal, but a sign the risk/reward is tilting.
Watch how price behaves at this level over the next few sessions. If buyers defend it again, the probabilities improve. If it breaks cleanly, the wick was just noise.
Price action doesn't lie. Volume and follow-through do the rest.