$AVAX - A Wolf in Sheep’s Clothing🚨
Is a 597% move just the beginning?
Take a look at the monthly chart. This is one of the most interesting long-term structures I’m watching right now.
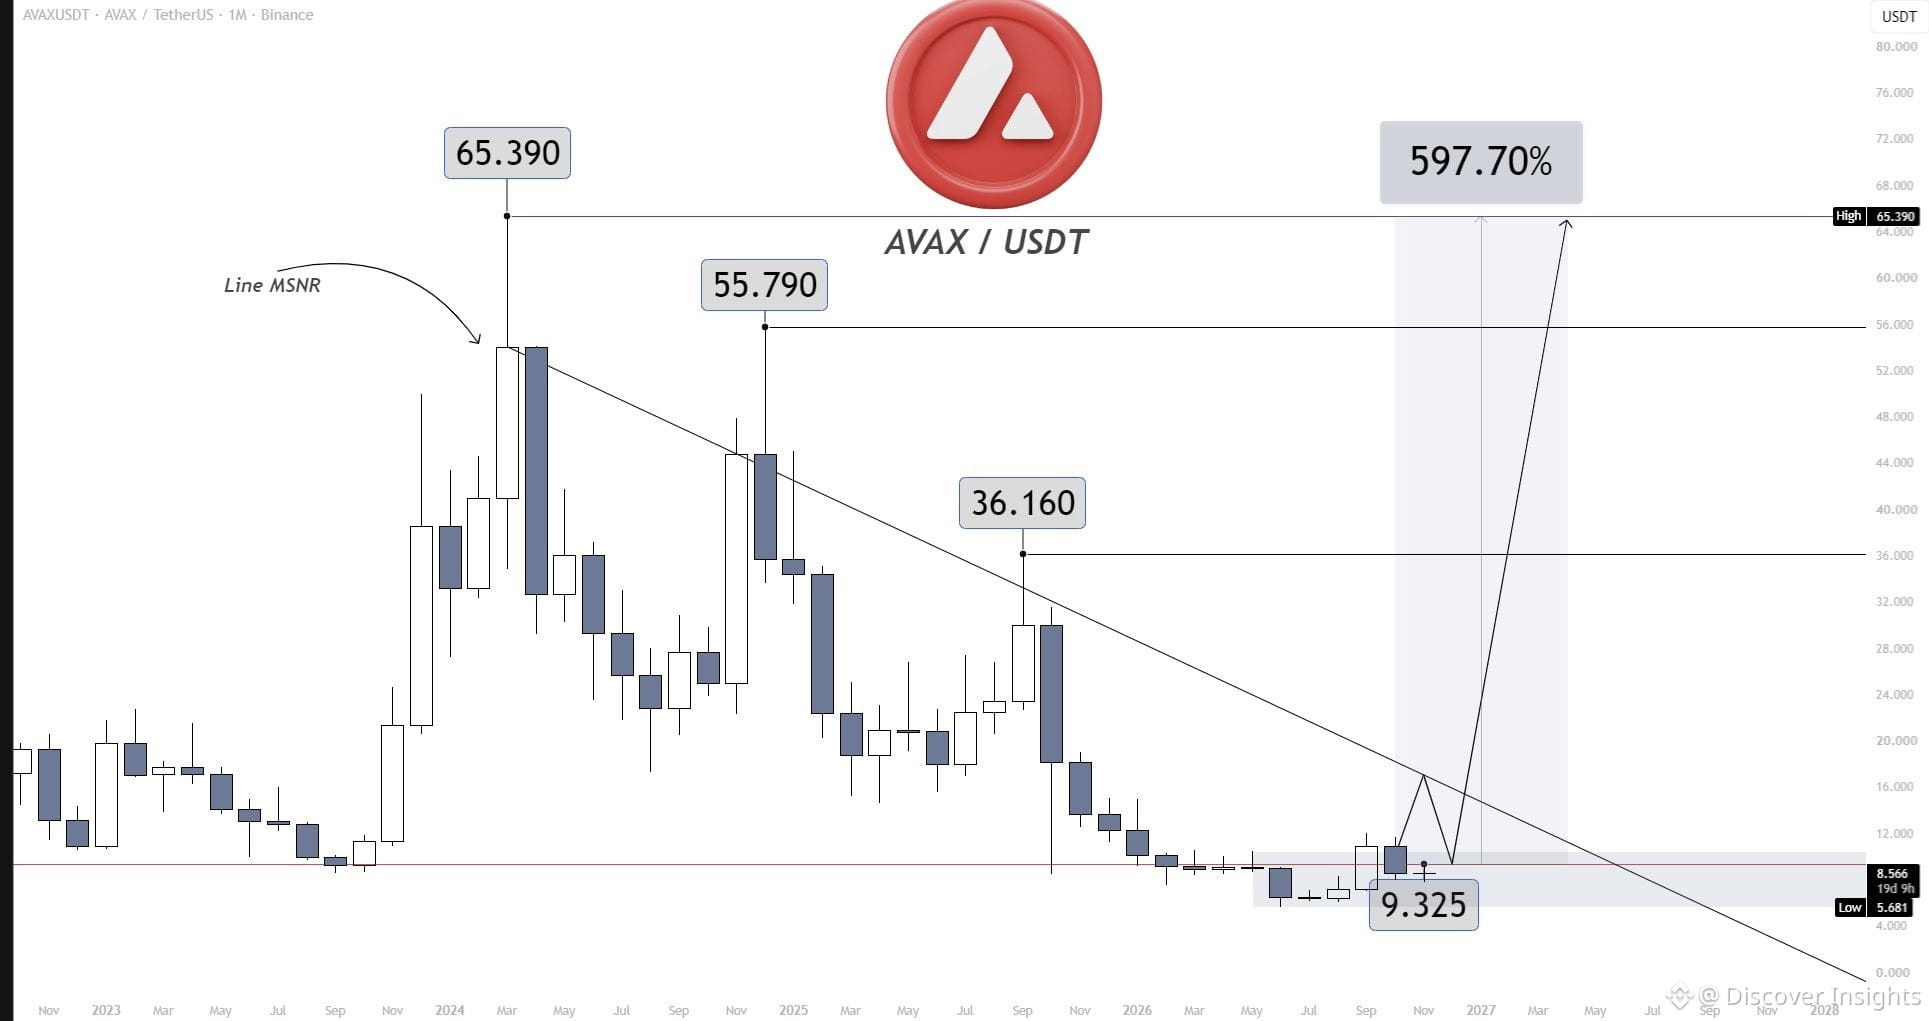
After an extended decline from its previous cycle highs, AVAX is approaching a major accumulation zone, where price has started showing signs of stabilization.
Here is what makes this chart interesting:
1. The descending resistance
AVAX has been trading below a major descending resistance line for an extended period.
A confirmed breakout and monthly close above this trendline could be the first major signal of a long-term trend reversal.
1. The accumulation zone
The 5.681$–9.325$ area is extremely important.
We are approaching a historical demand region, and I want to see how price reacts here.
The 8.566$ level is another important reference point. Losing this area could expose the lower liquidity around 5.681$.
1. The liquidity pools above
If the market confirms a reversal, these are the levels I will be watching:
1. 16$–17$ - first major resistance and liquidity target.
2. 36.160$ - next significant liquidity pool.
3. 55.790$ - major historical resistance.
4. 65.390$ - previous cycle high and my main long-term target.
My outlook:
I believe AVAX has the potential to deliver a massive move in the next major expansion of the crypto market.
From the current area around 9.325$ to 65.390$ we are looking at approximately 598% upside.
Of course, this is a long-term scenario, not an overnight prediction. I want to see confirmation, a breakout of the descending resistance, and a proper change in market structure.
But one thing is clear: AVAX is definitely an asset worth keeping on your watchlist.
Sometimes the biggest opportunities appear when nobody wants to look at the chart anymore.
#HuangExitNvidiaStrategyInFocus
$AVAX
Is a 597% move just the beginning?
Take a look at the monthly chart. This is one of the most interesting long-term structures I’m watching right now.
After an extended decline from its previous cycle highs, AVAX is approaching a major accumulation zone, where price has started showing signs of stabilization.
Here is what makes this chart interesting:
1. The descending resistance
AVAX has been trading below a major descending resistance line for an extended period.
A confirmed breakout and monthly close above this trendline could be the first major signal of a long-term trend reversal.
1. The accumulation zone
The 5.681$–9.325$ area is extremely important.
We are approaching a historical demand region, and I want to see how price reacts here.
The 8.566$ level is another important reference point. Losing this area could expose the lower liquidity around 5.681$.
1. The liquidity pools above
If the market confirms a reversal, these are the levels I will be watching:
1. 16$–17$ - first major resistance and liquidity target.
2. 36.160$ - next significant liquidity pool.
3. 55.790$ - major historical resistance.
4. 65.390$ - previous cycle high and my main long-term target.
My outlook:
I believe AVAX has the potential to deliver a massive move in the next major expansion of the crypto market.
From the current area around 9.325$ to 65.390$ we are looking at approximately 598% upside.
Of course, this is a long-term scenario, not an overnight prediction. I want to see confirmation, a breakout of the descending resistance, and a proper change in market structure.
But one thing is clear: AVAX is definitely an asset worth keeping on your watchlist.
Sometimes the biggest opportunities appear when nobody wants to look at the chart anymore.
#HuangExitNvidiaStrategyInFocus
$AVAX