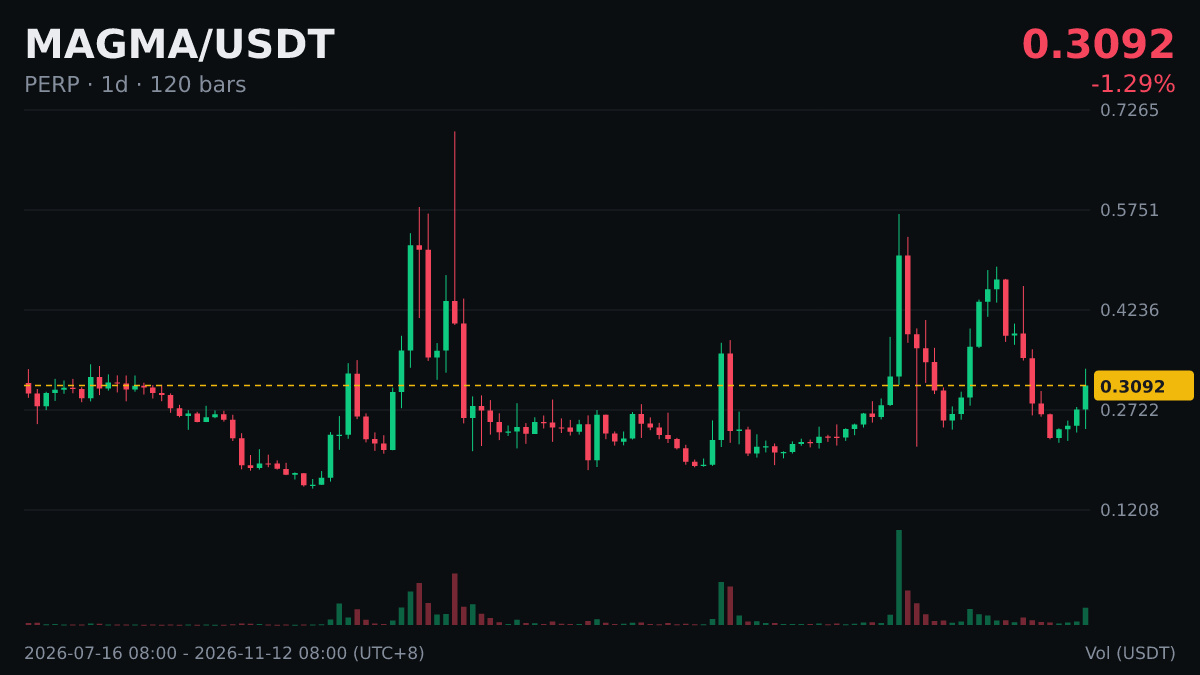
$MAGMA |Daily chart above MA200|MA200 0.2999
Before looking at position size, first understand moving averages.
On the daily chart, MA200 is the average closing price over the past 200 days, often used as a reference for the bull or bear trend; MA50 is often used to gauge the medium-term trend.
Many people wait for the price to move above a moving average and then pull back without breaking below it before taking the move seriously; after a break below, they wait for a rebound that fails to move back above it.
Working out your order size based on where you place your stop-loss is much more reliable than choosing a position size by guesswork.
Before looking at position size, first understand moving averages.
On the daily chart, MA200 is the average closing price over the past 200 days, often used as a reference for the bull or bear trend; MA50 is often used to gauge the medium-term trend.
Many people wait for the price to move above a moving average and then pull back without breaking below it before taking the move seriously; after a break below, they wait for a rebound that fails to move back above it.
Working out your order size based on where you place your stop-loss is much more reliable than choosing a position size by guesswork.