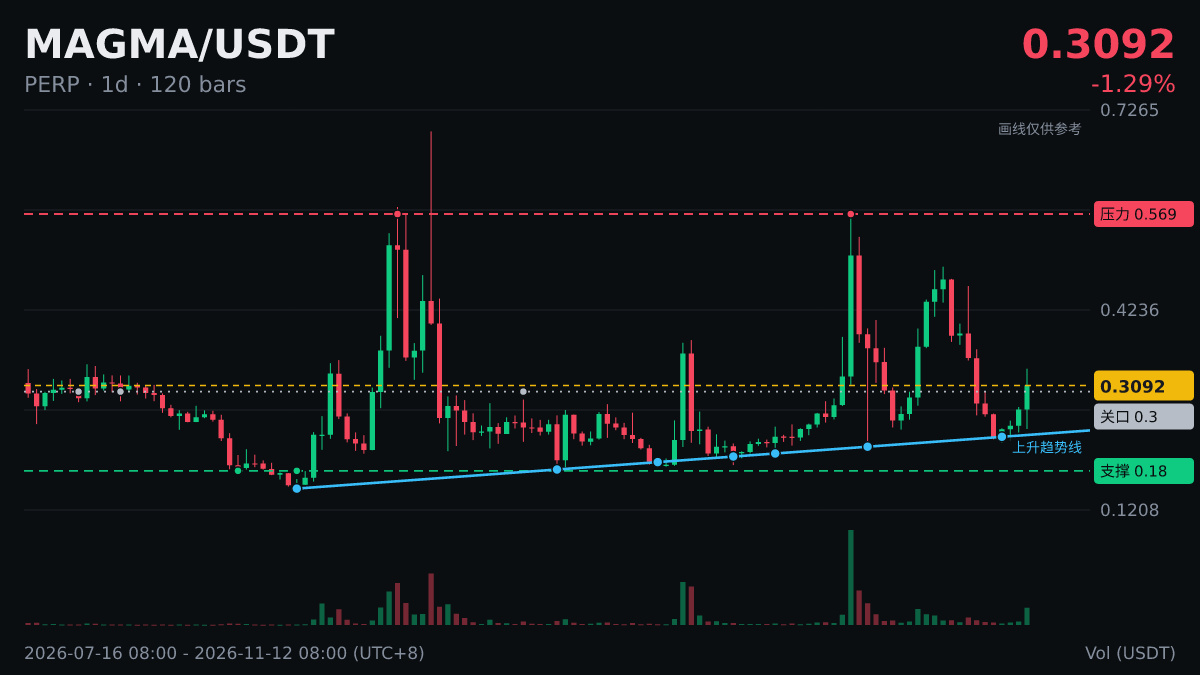
🐋 $MAGMA daily chart is above MA200 (0.2999).
This is a moving average that many medium- to long-term traders keep an eye on, but first, let's clarify what it is.
There are two types of moving averages: simple and exponential. Here, MA generally refers to the arithmetic average, where each candlestick has equal weight; EMA gives more weight to recent prices.
Understanding an indicator is about being less misled by numbers, not using it to predict tops and bottoms.
This is a moving average that many medium- to long-term traders keep an eye on, but first, let's clarify what it is.
There are two types of moving averages: simple and exponential. Here, MA generally refers to the arithmetic average, where each candlestick has equal weight; EMA gives more weight to recent prices.
Understanding an indicator is about being less misled by numbers, not using it to predict tops and bottoms.