Capital flows often show up in trading activity:
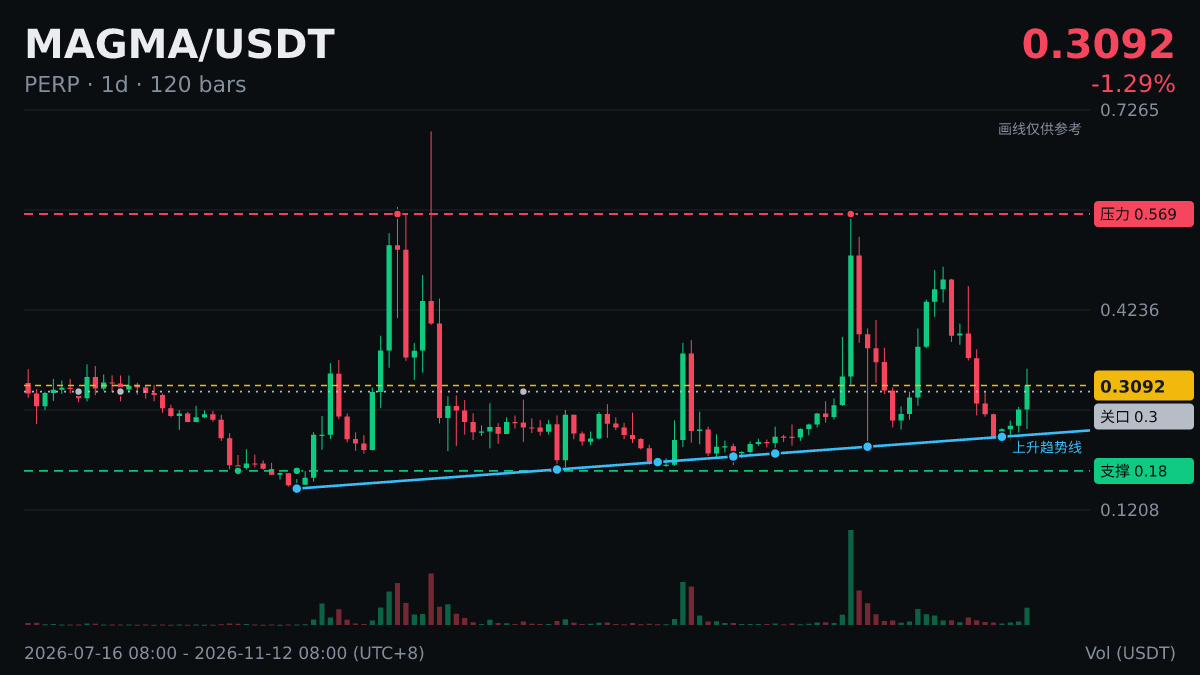
$MAGMA 's daily chart is above MA200 (0.2999).
Many trend-following and quantitative funds keep an eye on medium- to long-term moving averages like this. Moving above one often attracts follow-up buying; watch to see whether trading volume picks up.
What’s your take on this level?
For personal reference only; not investment advice.
$MAGMA 's daily chart is above MA200 (0.2999).
Many trend-following and quantitative funds keep an eye on medium- to long-term moving averages like this. Moving above one often attracts follow-up buying; watch to see whether trading volume picks up.
What’s your take on this level?
For personal reference only; not investment advice.