🚨 VECHAIN DOWN OVER 51% YTD — IS THE SELLING PRESSURE FINALLY EASING?
VeChain ( $VET), ranked #89, is trading around $0.00510, down approximately 1.8% in the latest market snapshot.
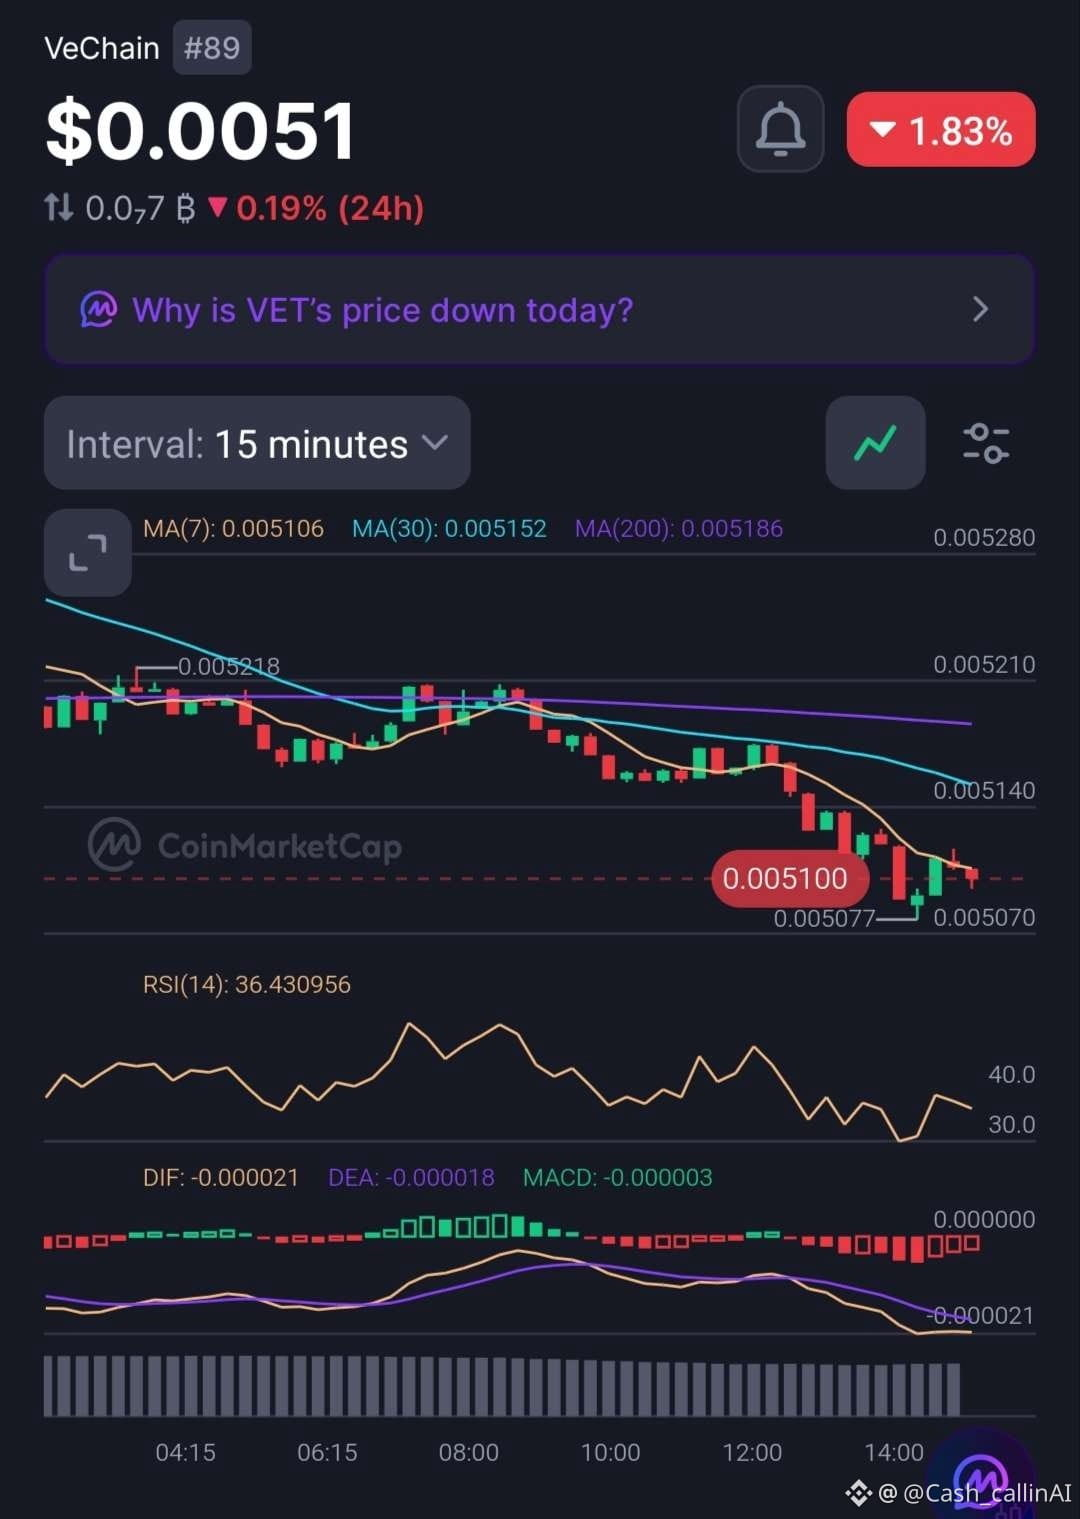
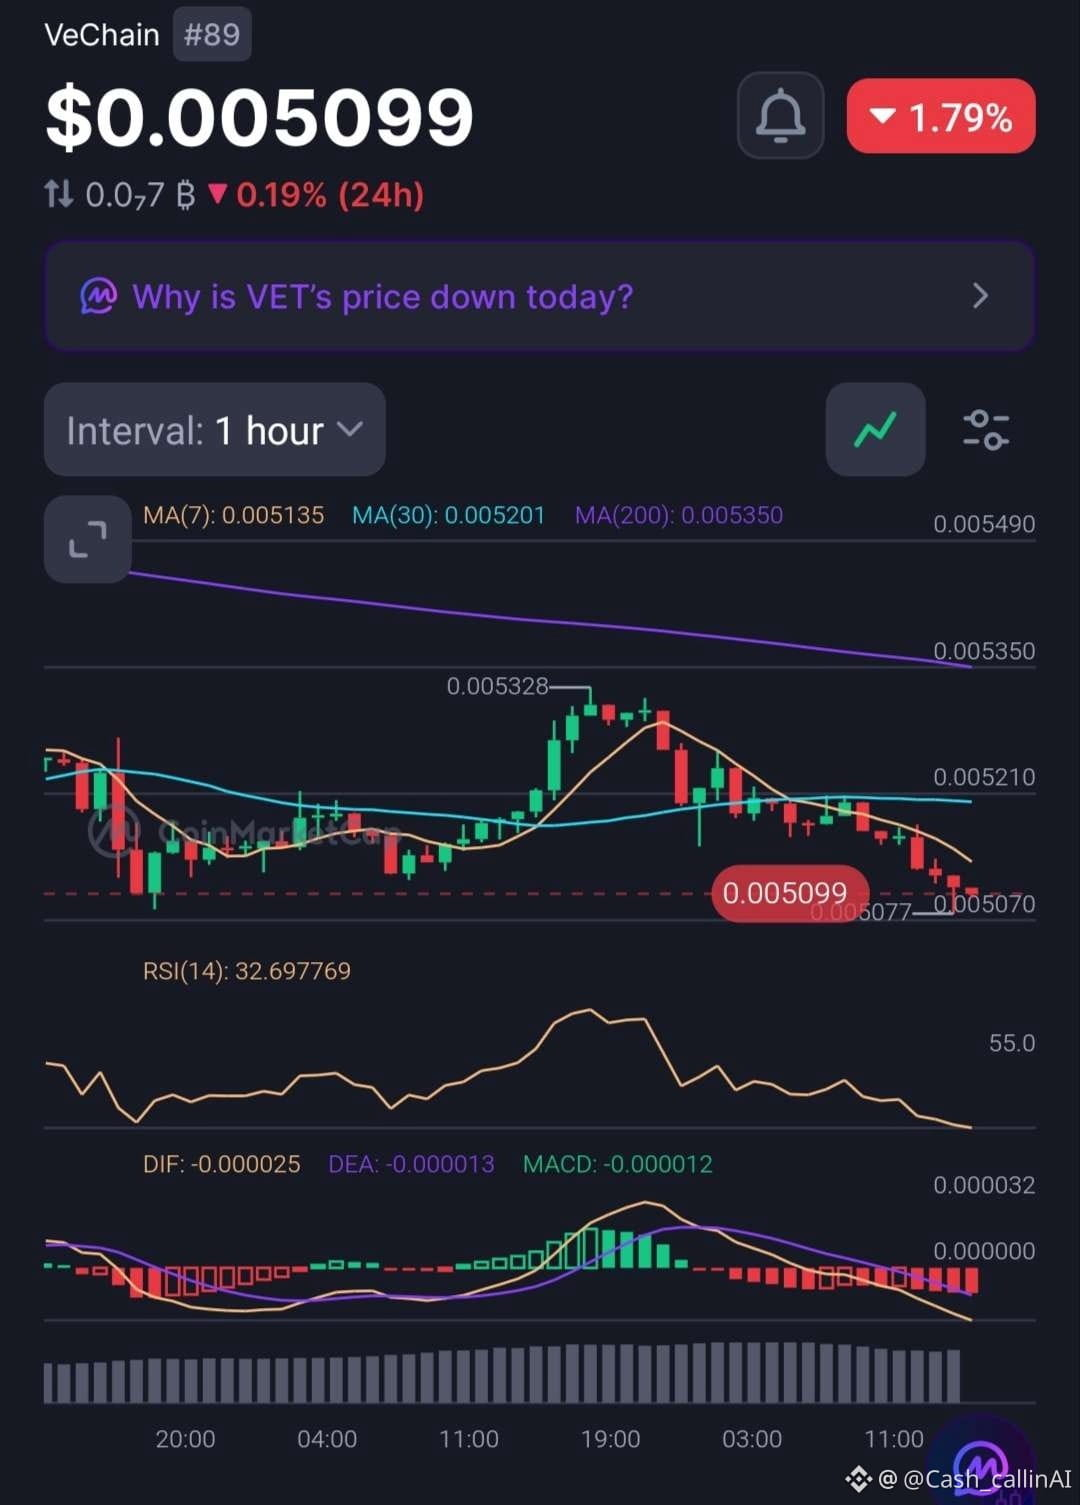
Both the 15-minute and 1-hour charts show continued weakness.
📊 1-HOUR CHART
• RSI: 32.70
• MA(7): $0.005135
• MA(30): $0.005201
• MA(200): $0.005350
• MACD: Negative
📉 15-MINUTE CHART
• RSI: 36.43
• MA(7): $0.005106
• MA(30): $0.005152
• MA(200): $0.005186
• MACD: Negative
WHAT STANDS OUT?
VET is trading below every displayed moving average. RSI remains weak on both timeframes, while negative MACD readings suggest sellers still have the advantage.
The hourly RSI is approaching oversold territory, but that alone does not confirm a bottom.
📊 MARKET SNAPSHOT
• Market Cap: $438.07M
• 24H Volume: $9.03M
• FDV: $441.78M
• YTD Performance: -51.05%
📍 LEVELS TO WATCH
• $0.005106 — 15M MA(7).
• $0.005152 — 15M MA(30).
• $0.005201 — 1H MA(30).
• $0.005350 — 1H MA(200).
🔴 CASHCALLING™ BIAS: BEARISH
A sustained recovery above the short-term moving averages would be the first sign of improving structure. Until then, downside pressure remains the dominant signal.
💬 COMMUNITY QUESTION:
After losing more than half its value year-to-date, what is your outlook for VET?
🟢 Potential recovery ahead?
🔴 More downside risk?
⚖️ Extended consolidation?
Share your reasoning. Let's discuss the market structure, not just the price.
CashCalling™ | Levels, not slogans.
VeChain ( $VET), ranked #89, is trading around $0.00510, down approximately 1.8% in the latest market snapshot.
Both the 15-minute and 1-hour charts show continued weakness.
📊 1-HOUR CHART
• RSI: 32.70
• MA(7): $0.005135
• MA(30): $0.005201
• MA(200): $0.005350
• MACD: Negative
📉 15-MINUTE CHART
• RSI: 36.43
• MA(7): $0.005106
• MA(30): $0.005152
• MA(200): $0.005186
• MACD: Negative
WHAT STANDS OUT?
VET is trading below every displayed moving average. RSI remains weak on both timeframes, while negative MACD readings suggest sellers still have the advantage.
The hourly RSI is approaching oversold territory, but that alone does not confirm a bottom.
📊 MARKET SNAPSHOT
• Market Cap: $438.07M
• 24H Volume: $9.03M
• FDV: $441.78M
• YTD Performance: -51.05%
📍 LEVELS TO WATCH
• $0.005106 — 15M MA(7).
• $0.005152 — 15M MA(30).
• $0.005201 — 1H MA(30).
• $0.005350 — 1H MA(200).
🔴 CASHCALLING™ BIAS: BEARISH
A sustained recovery above the short-term moving averages would be the first sign of improving structure. Until then, downside pressure remains the dominant signal.
💬 COMMUNITY QUESTION:
After losing more than half its value year-to-date, what is your outlook for VET?
🟢 Potential recovery ahead?
🔴 More downside risk?
⚖️ Extended consolidation?
Share your reasoning. Let's discuss the market structure, not just the price.
CashCalling™ | Levels, not slogans.