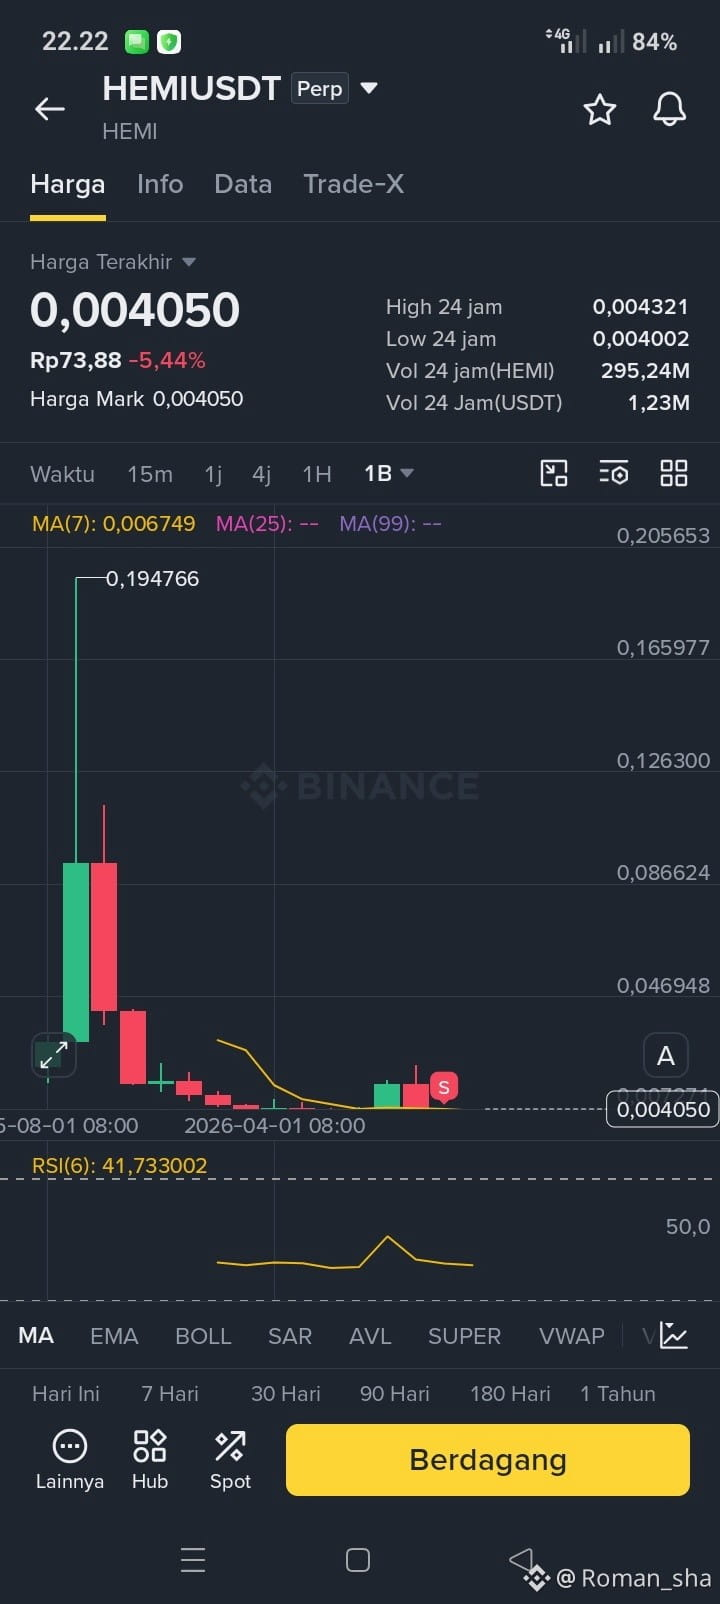
Two Sides of the Coin on the $HEMI Chart 📊
The $HEMI chart is a real example of just how wild volatility can get in the crypto market. It once soared to a high of 0.194766, then came crashing down nearly 97.91% to 0.004050. Many people thought this coin was finished.
But in the crypto market, perspective is everything. The same numbers, viewed from the bottom up, mean it would take a 4,707%+ rally to get back to the sky.
You don't have to guess when it'll return to its ATH—a small technical rebound from the bottom of the abyss could already be enough to make you smile.
Just fine-tune your strategy, patiently wait for the market to turn around, and let time do its work. What do you think the future holds for $HEMI?
#BinanceSquare
The $HEMI chart is a real example of just how wild volatility can get in the crypto market. It once soared to a high of 0.194766, then came crashing down nearly 97.91% to 0.004050. Many people thought this coin was finished.
But in the crypto market, perspective is everything. The same numbers, viewed from the bottom up, mean it would take a 4,707%+ rally to get back to the sky.
You don't have to guess when it'll return to its ATH—a small technical rebound from the bottom of the abyss could already be enough to make you smile.
Just fine-tune your strategy, patiently wait for the market to turn around, and let time do its work. What do you think the future holds for $HEMI?
#BinanceSquare