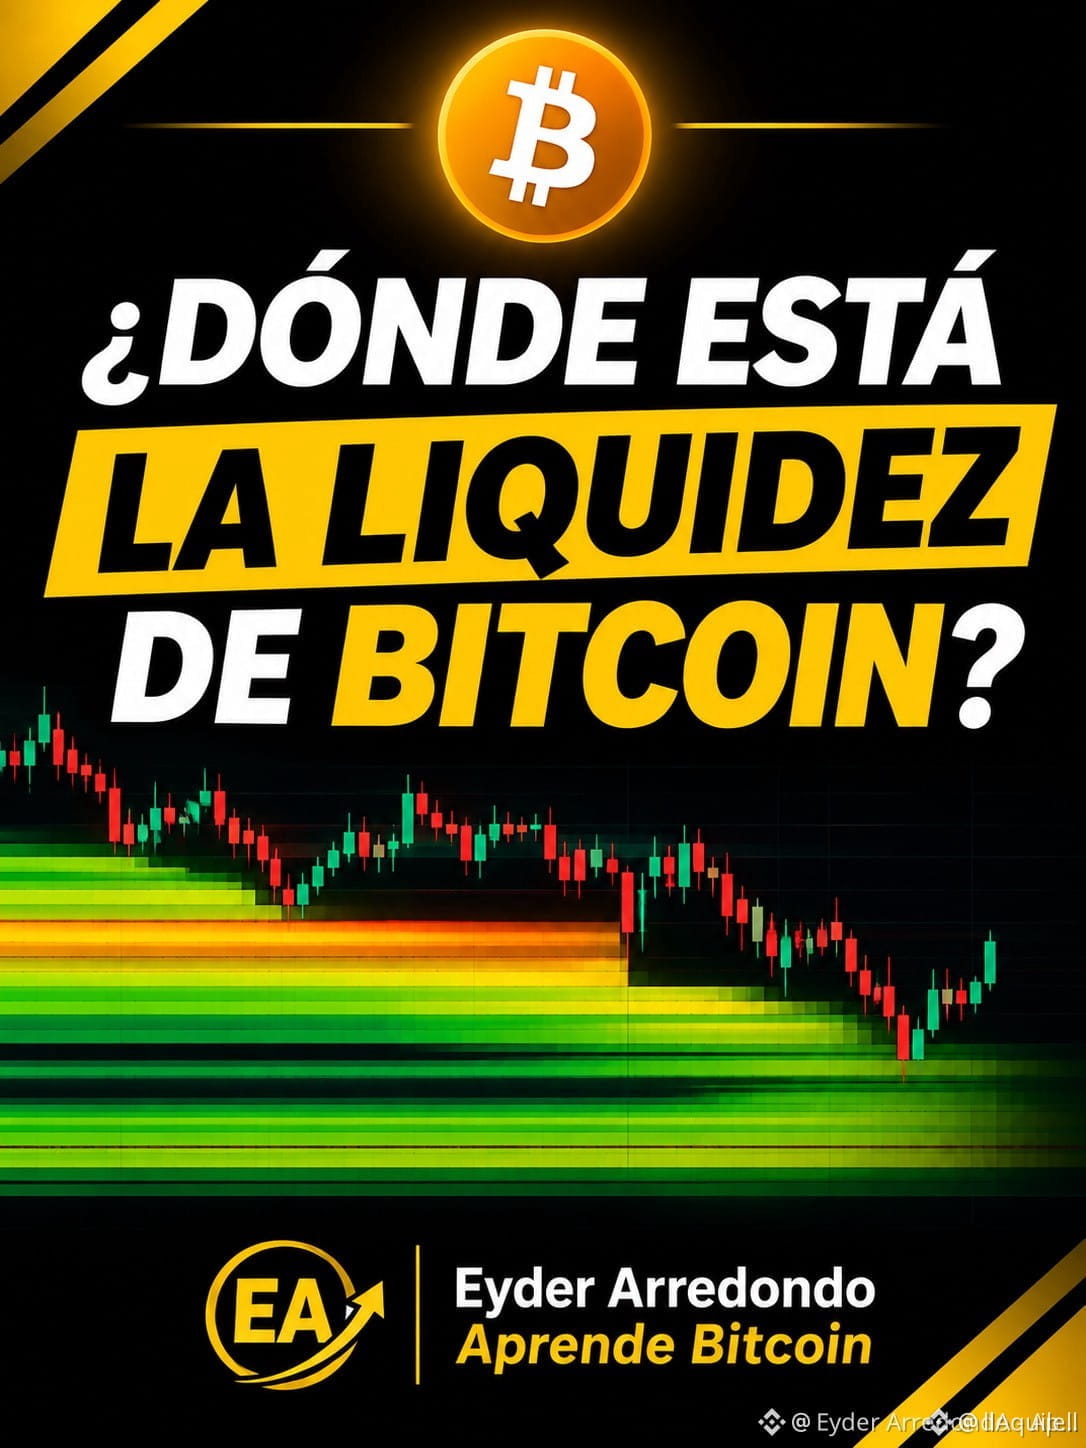
As I study the market for $BTC and learn to trade Futures, I discovered an interesting tool: liquidation heatmaps.
What are they used for?
They allow us to visualize areas where liquidations of leveraged positions, both LONG and SHORT, may be concentrated.
But first, we need to understand something:
🔹 What is a LONG liquidation?
When a trader opens a LONG position, they expect Bitcoin to rise. If the price falls too far and their margin is insufficient, their position may be automatically closed by the exchange.
🔹 And what is a SHORT liquidation?
The opposite happens: the trader bets on a price drop, but if Bitcoin rises too much, they may lose their margin and be liquidated.
🔹 What do the map’s colors represent?
The more intensely colored bands usually represent higher estimated concentrations of potential liquidations, depending on the indicator used.
Why is it important to watch them?
Because when the price approaches an area with many leveraged positions at risk, cascading liquidations may occur, increasing volatility and accelerating market movements.
How can we use this information?
If we’re considering a possible SHORT, we can check whether there are concentrations of LONG liquidations below the current price.
This can help us identify potential areas of interest for our exit targets.
A liquidation map does NOT indicate with certainty where Bitcoin is headed. Nor does it guarantee that the price will reach those areas.
That’s why we should combine it with:
📊 Technical analysis and price structure.
📊 Trading volume.
📊 Open Interest.
📊 Funding Rate.
📊 Support and resistance levels.
Trading Futures isn’t simply about guessing whether Bitcoin will rise or fall.
It also involves understanding where other participants’ risk may be concentrated and how their positions can influence market movements.
Educational content. This is not financial advice.
#Binance
What are they used for?
They allow us to visualize areas where liquidations of leveraged positions, both LONG and SHORT, may be concentrated.
But first, we need to understand something:
🔹 What is a LONG liquidation?
When a trader opens a LONG position, they expect Bitcoin to rise. If the price falls too far and their margin is insufficient, their position may be automatically closed by the exchange.
🔹 And what is a SHORT liquidation?
The opposite happens: the trader bets on a price drop, but if Bitcoin rises too much, they may lose their margin and be liquidated.
🔹 What do the map’s colors represent?
The more intensely colored bands usually represent higher estimated concentrations of potential liquidations, depending on the indicator used.
Why is it important to watch them?
Because when the price approaches an area with many leveraged positions at risk, cascading liquidations may occur, increasing volatility and accelerating market movements.
How can we use this information?
If we’re considering a possible SHORT, we can check whether there are concentrations of LONG liquidations below the current price.
This can help us identify potential areas of interest for our exit targets.
A liquidation map does NOT indicate with certainty where Bitcoin is headed. Nor does it guarantee that the price will reach those areas.
That’s why we should combine it with:
📊 Technical analysis and price structure.
📊 Trading volume.
📊 Open Interest.
📊 Funding Rate.
📊 Support and resistance levels.
Trading Futures isn’t simply about guessing whether Bitcoin will rise or fall.
It also involves understanding where other participants’ risk may be concentrated and how their positions can influence market movements.
Educational content. This is not financial advice.
#Binance