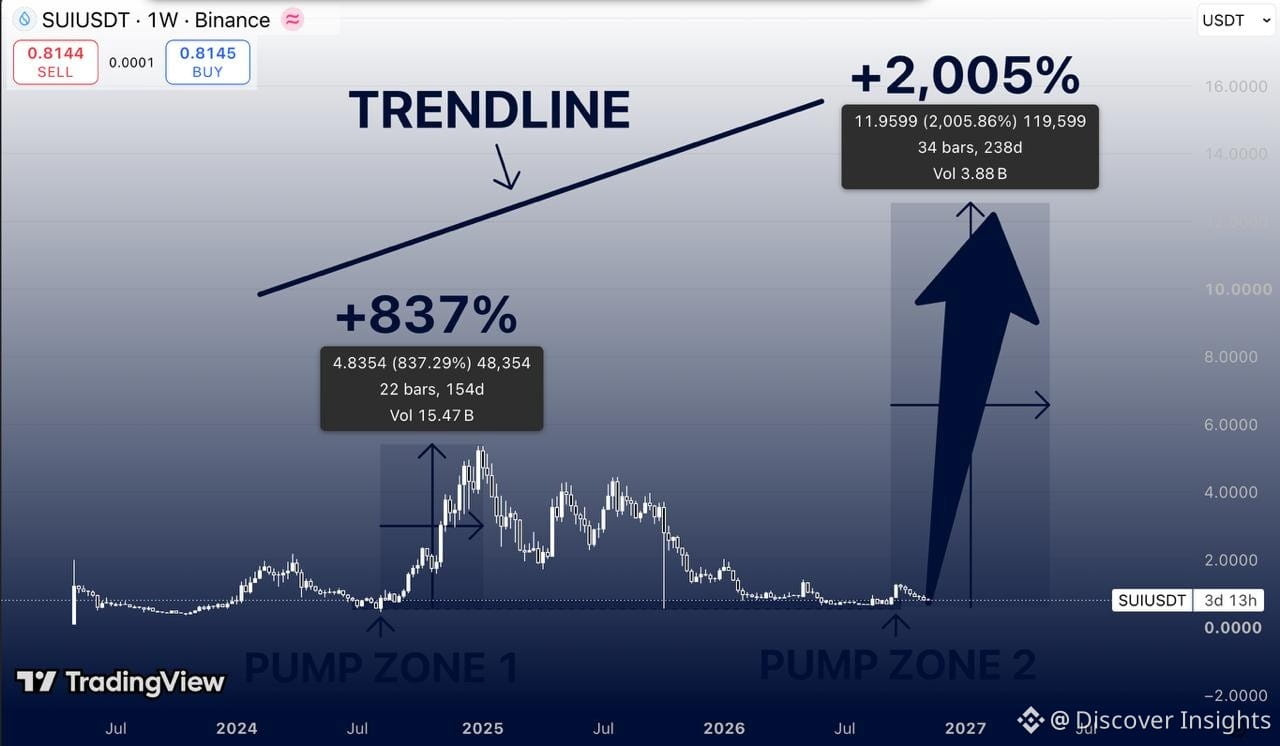
$SUI is trading around $0.81.
And this weekly chart is showing a setup that reminds me of what happened before its previous explosive rally.
Back in 2024, SUI delivered an incredible 837% move in just 154 days.
From a prolonged consolidation near the lows to above $5.
Then came the correction.
Lower highs. Failed recoveries. Months of persistent selling pressure.
Now look at where price is sitting.
SUI has returned to the same broad historical price region where its previous major rally began.
And that's what makes this setup interesting.
The market has spent months compressing near the lows, while the previous bullish expansion shows just how aggressively SUI can move when demand returns.
Could another major cycle be developing?
Possibly. But buyers still need to confirm it.
Here's my roadmap.
$1.20 — First resistance to reclaim.
$2.00 — Next major recovery level.
$3.00–4.00 — Historical supply zone.
$5.50 — Previous major high.
$8.00 — Potential continuation target.
And $12.80? That's my extreme bull scenario.
The chart illustrates a potential 2,005% rally from its marked historical base.
But a projected 20x doesn't mean another rally is guaranteed.
First, I want to see SUI establish higher lows and reclaim the $1.20–1.50 region with convincing weekly momentum.
A sustained break above $2 would strengthen the case for a larger structural reversal.
Without those confirmations, the broader bearish trend remains a risk.
And there's another important factor: token supply.
Future unlocks and changes in circulating supply could make a return to previous highs more challenging.
Still, here's what fascinates me.
In 2024, traders were chasing SUI above $4.
Now it's back near $0.80, and the market feels completely different.
That doesn't automatically mean it's undervalued.
But if buyers finally defend this long-term base and momentum shifts, SUI could become one of the more interesting recovery setups to watch.
I'm watching the structure first.
#HuangExitNvidiaStrategyInFocus
$SUI
And this weekly chart is showing a setup that reminds me of what happened before its previous explosive rally.
Back in 2024, SUI delivered an incredible 837% move in just 154 days.
From a prolonged consolidation near the lows to above $5.
Then came the correction.
Lower highs. Failed recoveries. Months of persistent selling pressure.
Now look at where price is sitting.
SUI has returned to the same broad historical price region where its previous major rally began.
And that's what makes this setup interesting.
The market has spent months compressing near the lows, while the previous bullish expansion shows just how aggressively SUI can move when demand returns.
Could another major cycle be developing?
Possibly. But buyers still need to confirm it.
Here's my roadmap.
$1.20 — First resistance to reclaim.
$2.00 — Next major recovery level.
$3.00–4.00 — Historical supply zone.
$5.50 — Previous major high.
$8.00 — Potential continuation target.
And $12.80? That's my extreme bull scenario.
The chart illustrates a potential 2,005% rally from its marked historical base.
But a projected 20x doesn't mean another rally is guaranteed.
First, I want to see SUI establish higher lows and reclaim the $1.20–1.50 region with convincing weekly momentum.
A sustained break above $2 would strengthen the case for a larger structural reversal.
Without those confirmations, the broader bearish trend remains a risk.
And there's another important factor: token supply.
Future unlocks and changes in circulating supply could make a return to previous highs more challenging.
Still, here's what fascinates me.
In 2024, traders were chasing SUI above $4.
Now it's back near $0.80, and the market feels completely different.
That doesn't automatically mean it's undervalued.
But if buyers finally defend this long-term base and momentum shifts, SUI could become one of the more interesting recovery setups to watch.
I'm watching the structure first.
#HuangExitNvidiaStrategyInFocus
$SUI