📉 NVDA — SHARP WATERFALL FLUSH & TESTING KEY SUPPORT! 🔄
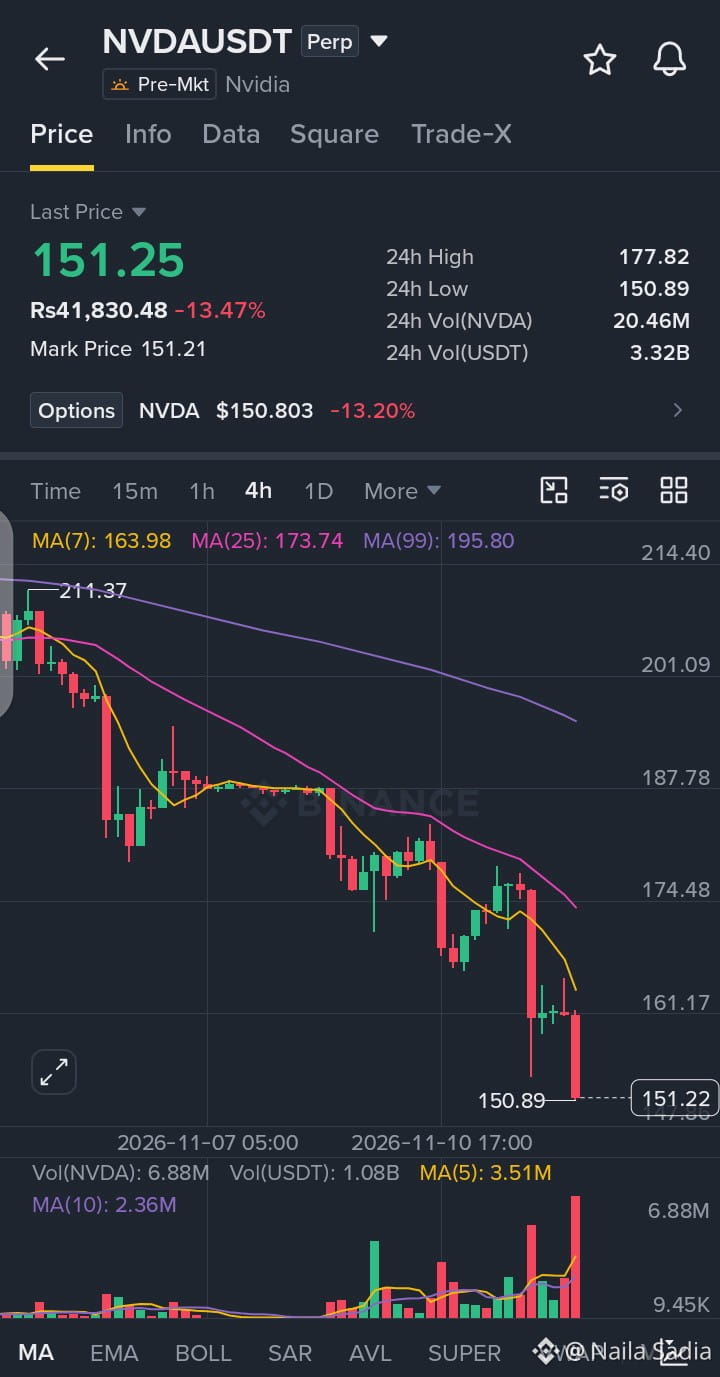
$NVDA is trading lower at 151.25 (-13.47%, or roughly Rs41,830.48), moving within an active 24-hour range between a high of 177.82 and a low of 150.89. Price action on this 4-hour chart displays an aggressive waterfall correction following the rejection from the 211.37 swing high, hovering well below the fast MA(7) (163.98), MA(25) (173.74), and macro structural MA(99) (195.80) moving average bands.
📊 QUICK TRADE PLAN — 4H
🟢 LONG ENTRY: 138.00–147.00 (strictly on confirmed volume exhaustion, heavy capitulation wicks, or structural stabilization signs)
🛑 STOP LOSS: 132.00
🎯 TP1: 172.00
🎯 TP2: 190.00
❓Are you watching for Nvidia to carve out a capitulation bottom near these psychological levels and attempt a relief bounce, or expecting further downside expansion?
Let's discuss below! 👇
👉 Trade: $NVDA
#NVDA #Nvidia #cryptotrading #BinanceSquare #TradingSignal
$NVDA is trading lower at 151.25 (-13.47%, or roughly Rs41,830.48), moving within an active 24-hour range between a high of 177.82 and a low of 150.89. Price action on this 4-hour chart displays an aggressive waterfall correction following the rejection from the 211.37 swing high, hovering well below the fast MA(7) (163.98), MA(25) (173.74), and macro structural MA(99) (195.80) moving average bands.
📊 QUICK TRADE PLAN — 4H
🟢 LONG ENTRY: 138.00–147.00 (strictly on confirmed volume exhaustion, heavy capitulation wicks, or structural stabilization signs)
🛑 STOP LOSS: 132.00
🎯 TP1: 172.00
🎯 TP2: 190.00
❓Are you watching for Nvidia to carve out a capitulation bottom near these psychological levels and attempt a relief bounce, or expecting further downside expansion?
Let's discuss below! 👇
👉 Trade: $NVDA
#NVDA #Nvidia #cryptotrading #BinanceSquare #TradingSignal